Jordanian vs Immigrants from Jamaica 3rd Grade
COMPARE
Jordanian
Immigrants from Jamaica
3rd Grade
3rd Grade Comparison
Jordanians
Immigrants from Jamaica
97.8%
3RD GRADE
74.5/ 100
METRIC RATING
150th/ 347
METRIC RANK
97.3%
3RD GRADE
0.3/ 100
METRIC RATING
265th/ 347
METRIC RANK
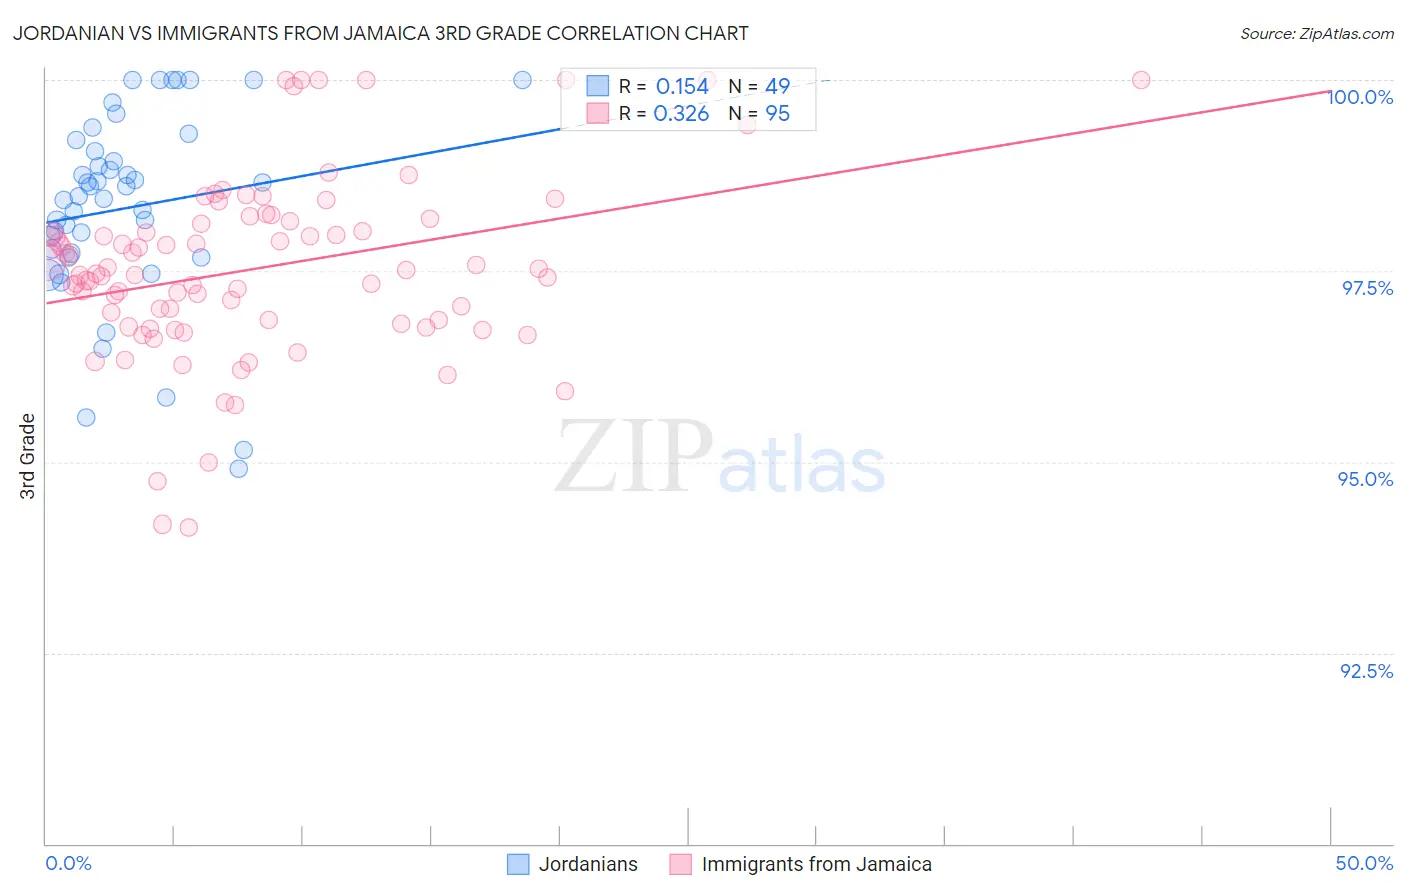
Jordanian vs Immigrants from Jamaica 3rd Grade Correlation Chart
The statistical analysis conducted on geographies consisting of 166,424,117 people shows a poor positive correlation between the proportion of Jordanians and percentage of population with at least 3rd grade education in the United States with a correlation coefficient (R) of 0.154 and weighted average of 97.8%. Similarly, the statistical analysis conducted on geographies consisting of 301,829,538 people shows a mild positive correlation between the proportion of Immigrants from Jamaica and percentage of population with at least 3rd grade education in the United States with a correlation coefficient (R) of 0.326 and weighted average of 97.3%, a difference of 0.59%.
3rd Grade Correlation Summary
| Measurement | Jordanian | Immigrants from Jamaica |
| Minimum | 94.9% | 94.1% |
| Maximum | 100.0% | 100.0% |
| Range | 5.1% | 5.9% |
| Mean | 98.3% | 97.5% |
| Median | 98.5% | 97.5% |
| Interquartile 25% (IQ1) | 97.7% | 96.8% |
| Interquartile 75% (IQ3) | 99.1% | 98.1% |
| Interquartile Range (IQR) | 1.4% | 1.3% |
| Standard Deviation (Sample) | 1.3% | 1.2% |
| Standard Deviation (Population) | 1.2% | 1.2% |
Similar Demographics by 3rd Grade
Demographics Similar to Jordanians by 3rd Grade
In terms of 3rd grade, the demographic groups most similar to Jordanians are Immigrants from North Macedonia (97.8%, a difference of 0.0%), Immigrants from Israel (97.9%, a difference of 0.010%), Immigrants from Moldova (97.9%, a difference of 0.010%), Soviet Union (97.8%, a difference of 0.010%), and Burmese (97.9%, a difference of 0.020%).
| Demographics | Rating | Rank | 3rd Grade |
| Filipinos | 79.9 /100 | #143 | Good 97.9% |
| Burmese | 79.6 /100 | #144 | Good 97.9% |
| Immigrants | Greece | 79.5 /100 | #145 | Good 97.9% |
| Alsatians | 78.3 /100 | #146 | Good 97.9% |
| Immigrants | Israel | 77.3 /100 | #147 | Good 97.9% |
| Immigrants | Moldova | 77.1 /100 | #148 | Good 97.9% |
| Immigrants | North Macedonia | 74.5 /100 | #149 | Good 97.8% |
| Jordanians | 74.5 /100 | #150 | Good 97.8% |
| Soviet Union | 72.6 /100 | #151 | Good 97.8% |
| Immigrants | South Central Asia | 69.5 /100 | #152 | Good 97.8% |
| Apache | 68.5 /100 | #153 | Good 97.8% |
| Immigrants | Eastern Europe | 64.1 /100 | #154 | Good 97.8% |
| Bermudans | 62.6 /100 | #155 | Good 97.8% |
| Immigrants | Russia | 61.7 /100 | #156 | Good 97.8% |
| Immigrants | Italy | 61.2 /100 | #157 | Good 97.8% |
Demographics Similar to Immigrants from Jamaica by 3rd Grade
In terms of 3rd grade, the demographic groups most similar to Immigrants from Jamaica are Taiwanese (97.3%, a difference of 0.010%), West Indian (97.3%, a difference of 0.010%), Yaqui (97.3%, a difference of 0.010%), Immigrants from Nigeria (97.3%, a difference of 0.010%), and Immigrants from South America (97.3%, a difference of 0.020%).
| Demographics | Rating | Rank | 3rd Grade |
| Immigrants | Liberia | 0.5 /100 | #258 | Tragic 97.3% |
| Armenians | 0.4 /100 | #259 | Tragic 97.3% |
| Immigrants | Ethiopia | 0.4 /100 | #260 | Tragic 97.3% |
| Immigrants | South America | 0.4 /100 | #261 | Tragic 97.3% |
| Immigrants | Sierra Leone | 0.4 /100 | #262 | Tragic 97.3% |
| Taiwanese | 0.3 /100 | #263 | Tragic 97.3% |
| West Indians | 0.3 /100 | #264 | Tragic 97.3% |
| Immigrants | Jamaica | 0.3 /100 | #265 | Tragic 97.3% |
| Yaqui | 0.3 /100 | #266 | Tragic 97.3% |
| Immigrants | Nigeria | 0.3 /100 | #267 | Tragic 97.3% |
| Cubans | 0.2 /100 | #268 | Tragic 97.3% |
| Fijians | 0.2 /100 | #269 | Tragic 97.3% |
| Immigrants | China | 0.2 /100 | #270 | Tragic 97.2% |
| Puerto Ricans | 0.2 /100 | #271 | Tragic 97.2% |
| Ghanaians | 0.1 /100 | #272 | Tragic 97.2% |