Jordanian vs Polish College, 1 year or more
COMPARE
Jordanian
Polish
College, 1 year or more
College, 1 year or more Comparison
Jordanians
Poles
62.2%
COLLEGE, 1 YEAR OR MORE
97.2/ 100
METRIC RATING
97th/ 347
METRIC RANK
60.7%
COLLEGE, 1 YEAR OR MORE
82.8/ 100
METRIC RATING
142nd/ 347
METRIC RANK
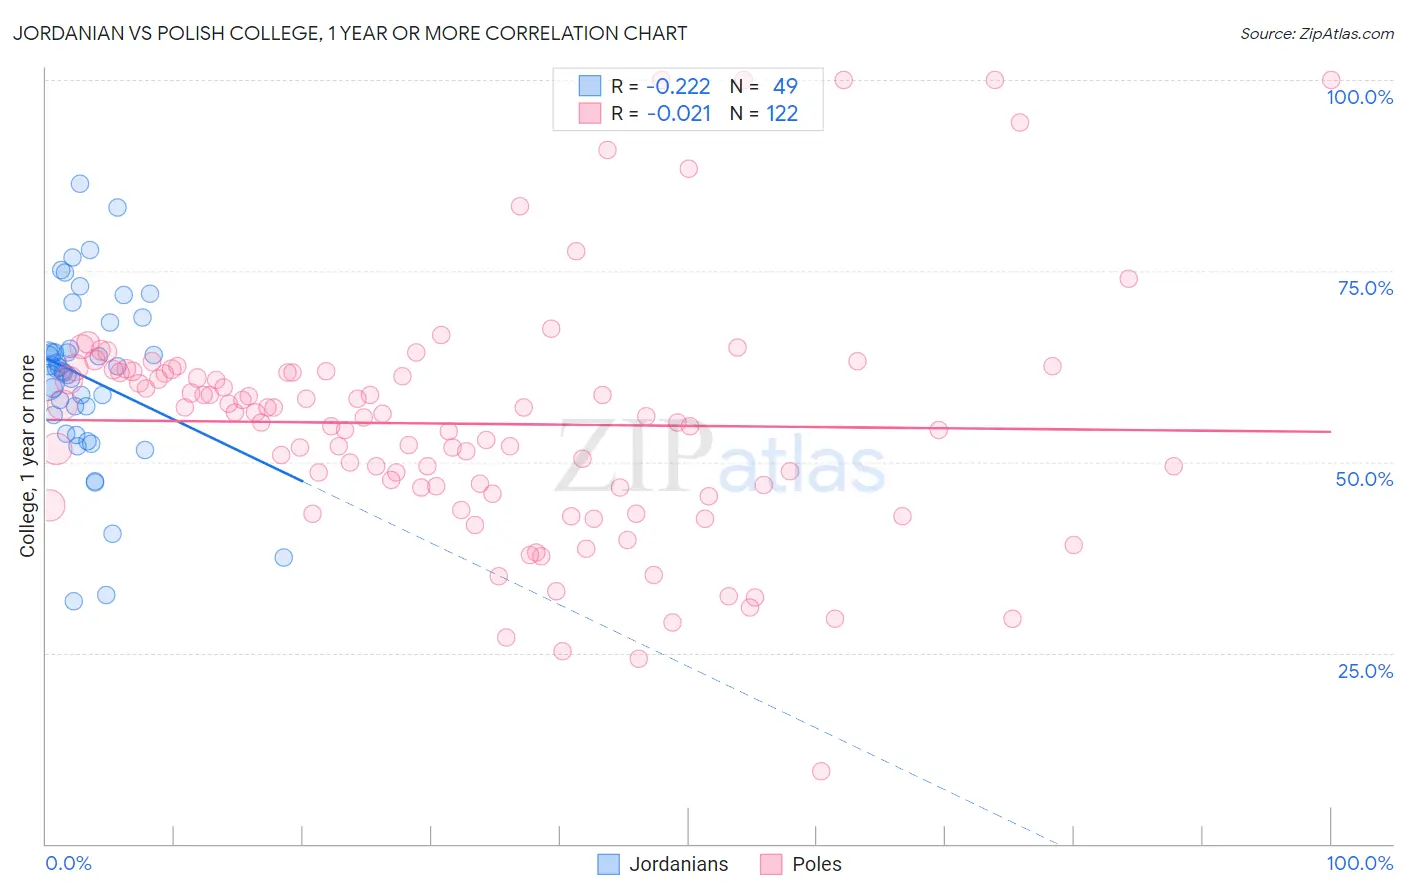
Jordanian vs Polish College, 1 year or more Correlation Chart
The statistical analysis conducted on geographies consisting of 166,424,117 people shows a weak negative correlation between the proportion of Jordanians and percentage of population with at least college, 1 year or more education in the United States with a correlation coefficient (R) of -0.222 and weighted average of 62.2%. Similarly, the statistical analysis conducted on geographies consisting of 560,585,948 people shows no correlation between the proportion of Poles and percentage of population with at least college, 1 year or more education in the United States with a correlation coefficient (R) of -0.021 and weighted average of 60.7%, a difference of 2.5%.
College, 1 year or more Correlation Summary
| Measurement | Jordanian | Polish |
| Minimum | 31.8% | 9.5% |
| Maximum | 86.4% | 100.0% |
| Range | 54.6% | 90.5% |
| Mean | 61.0% | 55.0% |
| Median | 62.1% | 55.9% |
| Interquartile 25% (IQ1) | 55.0% | 46.6% |
| Interquartile 75% (IQ3) | 66.5% | 61.7% |
| Interquartile Range (IQR) | 11.5% | 15.1% |
| Standard Deviation (Sample) | 11.4% | 16.1% |
| Standard Deviation (Population) | 11.3% | 16.0% |
Similar Demographics by College, 1 year or more
Demographics Similar to Jordanians by College, 1 year or more
In terms of college, 1 year or more, the demographic groups most similar to Jordanians are Carpatho Rusyn (62.2%, a difference of 0.0%), Chinese (62.2%, a difference of 0.010%), Croatian (62.2%, a difference of 0.010%), British (62.3%, a difference of 0.12%), and Icelander (62.1%, a difference of 0.17%).
| Demographics | Rating | Rank | College, 1 year or more |
| Immigrants | Western Asia | 97.9 /100 | #90 | Exceptional 62.5% |
| Immigrants | Eastern Europe | 97.8 /100 | #91 | Exceptional 62.4% |
| Immigrants | Egypt | 97.8 /100 | #92 | Exceptional 62.4% |
| Romanians | 97.7 /100 | #93 | Exceptional 62.4% |
| Immigrants | Croatia | 97.6 /100 | #94 | Exceptional 62.3% |
| British | 97.4 /100 | #95 | Exceptional 62.3% |
| Chinese | 97.2 /100 | #96 | Exceptional 62.2% |
| Jordanians | 97.2 /100 | #97 | Exceptional 62.2% |
| Carpatho Rusyns | 97.2 /100 | #98 | Exceptional 62.2% |
| Croatians | 97.1 /100 | #99 | Exceptional 62.2% |
| Icelanders | 96.8 /100 | #100 | Exceptional 62.1% |
| Swedes | 96.8 /100 | #101 | Exceptional 62.1% |
| Luxembourgers | 96.7 /100 | #102 | Exceptional 62.1% |
| Afghans | 96.4 /100 | #103 | Exceptional 62.0% |
| Chileans | 96.4 /100 | #104 | Exceptional 62.0% |
Demographics Similar to Poles by College, 1 year or more
In terms of college, 1 year or more, the demographic groups most similar to Poles are Canadian (60.6%, a difference of 0.010%), Immigrants from Afghanistan (60.7%, a difference of 0.030%), Iraqi (60.7%, a difference of 0.050%), Czech (60.6%, a difference of 0.080%), and Immigrants from Eritrea (60.7%, a difference of 0.14%).
| Demographics | Rating | Rank | College, 1 year or more |
| Immigrants | Uganda | 87.4 /100 | #135 | Excellent 60.9% |
| Basques | 87.2 /100 | #136 | Excellent 60.9% |
| Slovenes | 86.5 /100 | #137 | Excellent 60.9% |
| Taiwanese | 84.3 /100 | #138 | Excellent 60.7% |
| Immigrants | Eritrea | 84.3 /100 | #139 | Excellent 60.7% |
| Iraqis | 83.3 /100 | #140 | Excellent 60.7% |
| Immigrants | Afghanistan | 83.1 /100 | #141 | Excellent 60.7% |
| Poles | 82.8 /100 | #142 | Excellent 60.7% |
| Canadians | 82.7 /100 | #143 | Excellent 60.6% |
| Czechs | 81.9 /100 | #144 | Excellent 60.6% |
| Slavs | 81.1 /100 | #145 | Excellent 60.6% |
| Scottish | 80.2 /100 | #146 | Excellent 60.5% |
| Immigrants | Kenya | 79.1 /100 | #147 | Good 60.5% |
| Kenyans | 79.0 /100 | #148 | Good 60.5% |
| Brazilians | 79.0 /100 | #149 | Good 60.5% |