Japanese vs Somali GED/Equivalency
COMPARE
Japanese
Somali
GED/Equivalency
GED/Equivalency Comparison
Japanese
Somalis
82.4%
GED/EQUIVALENCY
0.0/ 100
METRIC RATING
287th/ 347
METRIC RANK
85.0%
GED/EQUIVALENCY
16.4/ 100
METRIC RATING
199th/ 347
METRIC RANK
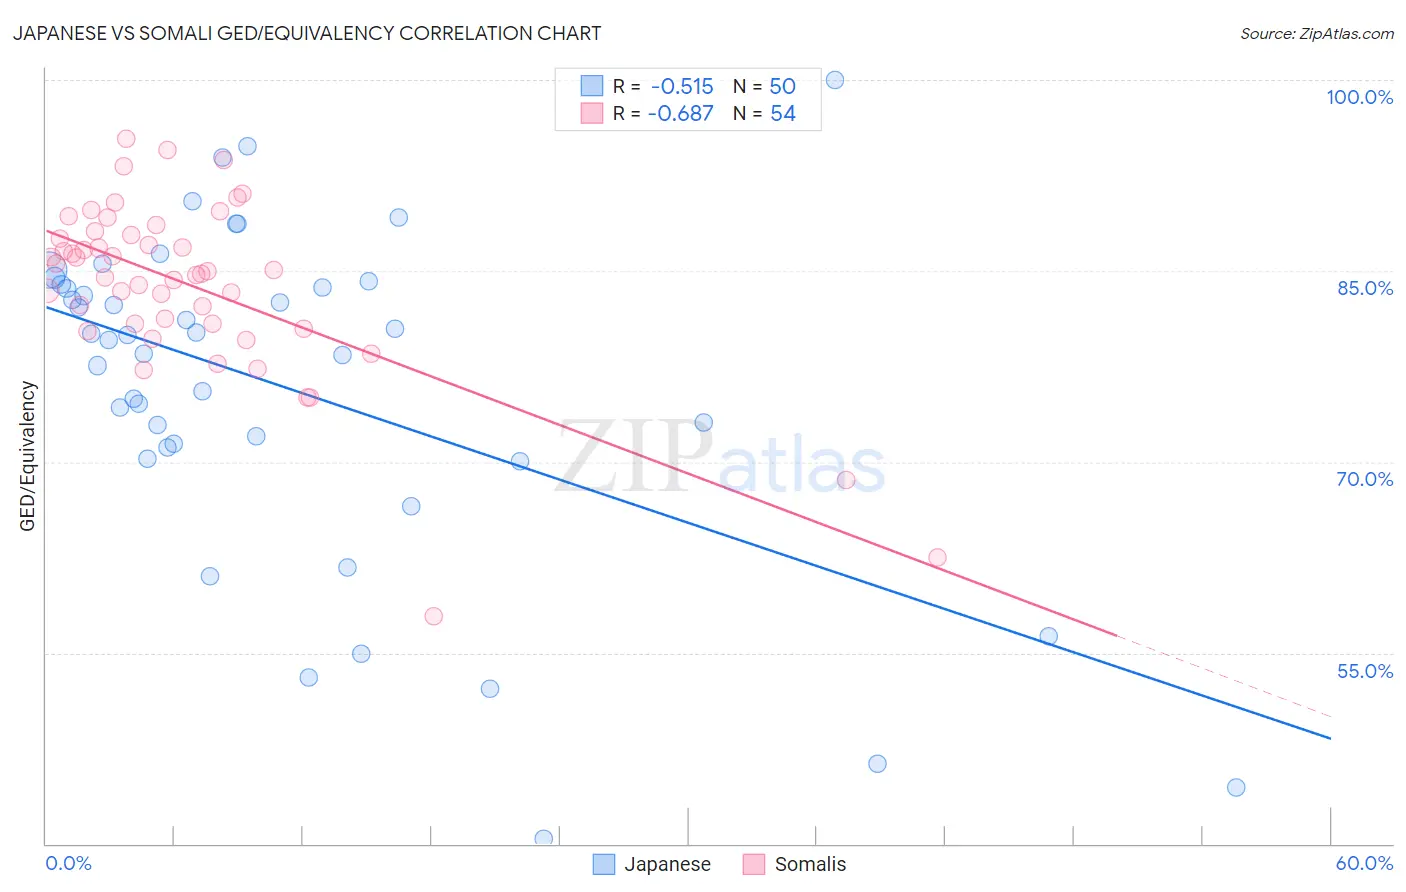
Japanese vs Somali GED/Equivalency Correlation Chart
The statistical analysis conducted on geographies consisting of 249,183,224 people shows a substantial negative correlation between the proportion of Japanese and percentage of population with at least ged/equivalency education in the United States with a correlation coefficient (R) of -0.515 and weighted average of 82.4%. Similarly, the statistical analysis conducted on geographies consisting of 99,332,457 people shows a significant negative correlation between the proportion of Somalis and percentage of population with at least ged/equivalency education in the United States with a correlation coefficient (R) of -0.687 and weighted average of 85.0%, a difference of 3.2%.
GED/Equivalency Correlation Summary
| Measurement | Japanese | Somali |
| Minimum | 40.4% | 57.9% |
| Maximum | 100.0% | 95.4% |
| Range | 59.6% | 37.5% |
| Mean | 75.8% | 83.8% |
| Median | 79.8% | 84.9% |
| Interquartile 25% (IQ1) | 71.1% | 80.8% |
| Interquartile 75% (IQ3) | 83.9% | 87.9% |
| Interquartile Range (IQR) | 12.8% | 7.1% |
| Standard Deviation (Sample) | 13.3% | 7.0% |
| Standard Deviation (Population) | 13.1% | 7.0% |
Similar Demographics by GED/Equivalency
Demographics Similar to Japanese by GED/Equivalency
In terms of ged/equivalency, the demographic groups most similar to Japanese are Immigrants from West Indies (82.4%, a difference of 0.020%), Cajun (82.4%, a difference of 0.040%), Immigrants from Barbados (82.4%, a difference of 0.070%), Pueblo (82.3%, a difference of 0.10%), and Immigrants from Cambodia (82.2%, a difference of 0.18%).
| Demographics | Rating | Rank | GED/Equivalency |
| Cheyenne | 0.1 /100 | #280 | Tragic 82.7% |
| Sioux | 0.1 /100 | #281 | Tragic 82.6% |
| Immigrants | Immigrants | 0.1 /100 | #282 | Tragic 82.6% |
| Indonesians | 0.1 /100 | #283 | Tragic 82.5% |
| Immigrants | Barbados | 0.1 /100 | #284 | Tragic 82.4% |
| Cajuns | 0.0 /100 | #285 | Tragic 82.4% |
| Immigrants | West Indies | 0.0 /100 | #286 | Tragic 82.4% |
| Japanese | 0.0 /100 | #287 | Tragic 82.4% |
| Pueblo | 0.0 /100 | #288 | Tragic 82.3% |
| Immigrants | Cambodia | 0.0 /100 | #289 | Tragic 82.2% |
| Haitians | 0.0 /100 | #290 | Tragic 82.1% |
| Cubans | 0.0 /100 | #291 | Tragic 82.0% |
| Paiute | 0.0 /100 | #292 | Tragic 82.0% |
| British West Indians | 0.0 /100 | #293 | Tragic 82.0% |
| Immigrants | St. Vincent and the Grenadines | 0.0 /100 | #294 | Tragic 82.0% |
Demographics Similar to Somalis by GED/Equivalency
In terms of ged/equivalency, the demographic groups most similar to Somalis are Uruguayan (85.0%, a difference of 0.010%), Portuguese (85.0%, a difference of 0.020%), Cree (85.0%, a difference of 0.020%), Immigrants from Africa (85.1%, a difference of 0.040%), and Panamanian (85.0%, a difference of 0.040%).
| Demographics | Rating | Rank | GED/Equivalency |
| Immigrants | Nonimmigrants | 22.7 /100 | #192 | Fair 85.2% |
| Delaware | 22.2 /100 | #193 | Fair 85.2% |
| Puget Sound Salish | 20.8 /100 | #194 | Fair 85.2% |
| Chippewa | 20.8 /100 | #195 | Fair 85.2% |
| Tongans | 20.7 /100 | #196 | Fair 85.2% |
| Costa Ricans | 20.4 /100 | #197 | Fair 85.2% |
| Immigrants | Africa | 17.5 /100 | #198 | Poor 85.1% |
| Somalis | 16.4 /100 | #199 | Poor 85.0% |
| Uruguayans | 16.0 /100 | #200 | Poor 85.0% |
| Portuguese | 15.9 /100 | #201 | Poor 85.0% |
| Cree | 15.9 /100 | #202 | Poor 85.0% |
| Panamanians | 15.3 /100 | #203 | Poor 85.0% |
| Hawaiians | 15.2 /100 | #204 | Poor 85.0% |
| Liberians | 14.6 /100 | #205 | Poor 85.0% |
| Samoans | 13.7 /100 | #206 | Poor 84.9% |