Japanese vs Immigrants from Kazakhstan 9th Grade
COMPARE
Japanese
Immigrants from Kazakhstan
9th Grade
9th Grade Comparison
Japanese
Immigrants from Kazakhstan
92.6%
9TH GRADE
0.0/ 100
METRIC RATING
305th/ 347
METRIC RANK
95.1%
9TH GRADE
74.7/ 100
METRIC RATING
155th/ 347
METRIC RANK
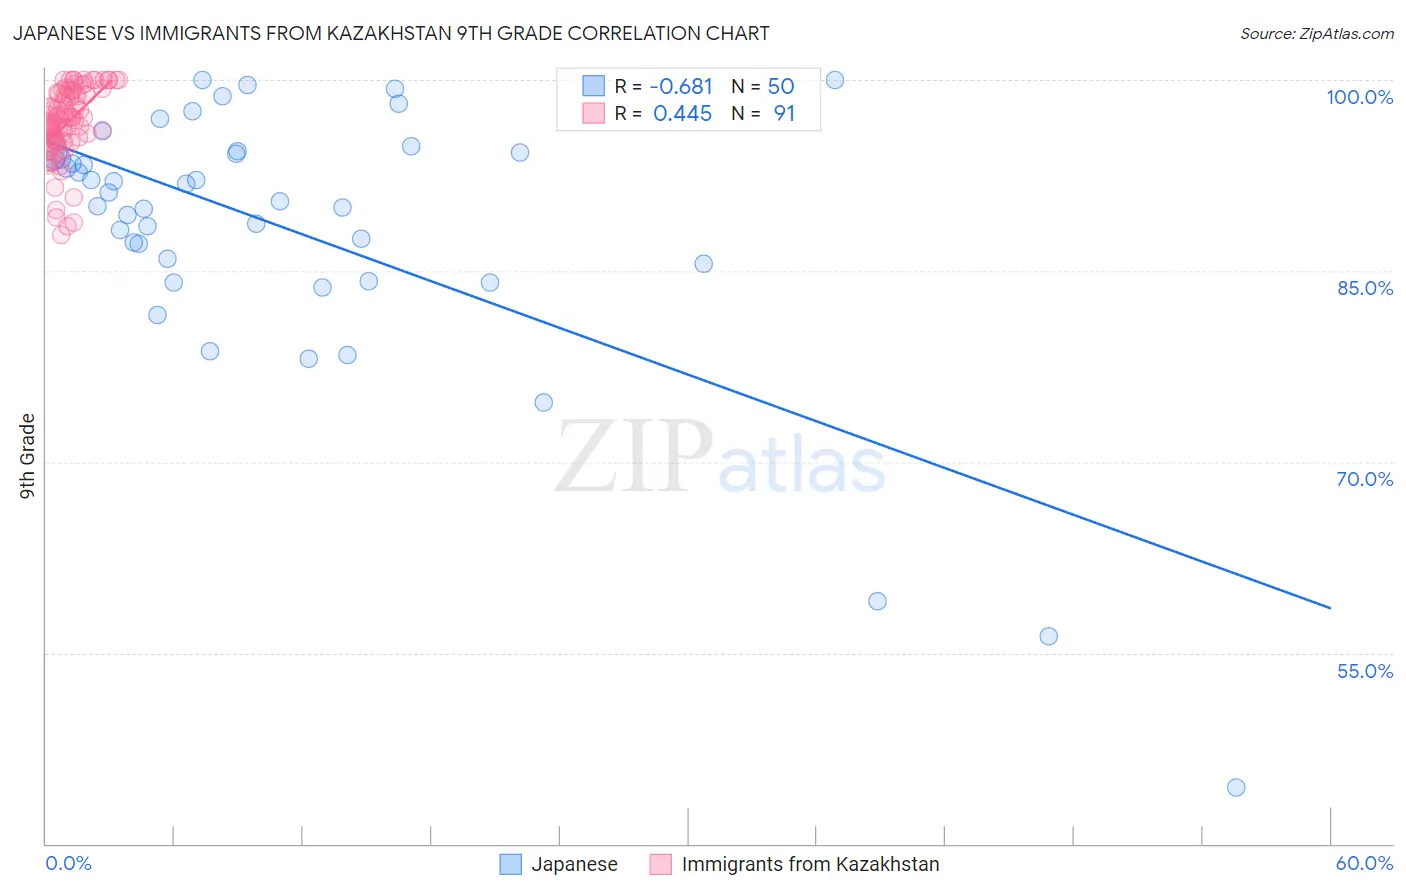
Japanese vs Immigrants from Kazakhstan 9th Grade Correlation Chart
The statistical analysis conducted on geographies consisting of 249,183,224 people shows a significant negative correlation between the proportion of Japanese and percentage of population with at least 9th grade education in the United States with a correlation coefficient (R) of -0.681 and weighted average of 92.6%. Similarly, the statistical analysis conducted on geographies consisting of 124,429,881 people shows a moderate positive correlation between the proportion of Immigrants from Kazakhstan and percentage of population with at least 9th grade education in the United States with a correlation coefficient (R) of 0.445 and weighted average of 95.1%, a difference of 2.6%.
9th Grade Correlation Summary
| Measurement | Japanese | Immigrants from Kazakhstan |
| Minimum | 44.4% | 87.8% |
| Maximum | 100.0% | 100.0% |
| Range | 55.6% | 12.2% |
| Mean | 88.3% | 96.6% |
| Median | 90.8% | 96.9% |
| Interquartile 25% (IQ1) | 85.6% | 95.3% |
| Interquartile 75% (IQ3) | 94.3% | 98.9% |
| Interquartile Range (IQR) | 8.7% | 3.7% |
| Standard Deviation (Sample) | 10.9% | 2.8% |
| Standard Deviation (Population) | 10.8% | 2.8% |
Similar Demographics by 9th Grade
Demographics Similar to Japanese by 9th Grade
In terms of 9th grade, the demographic groups most similar to Japanese are Immigrants from Vietnam (92.6%, a difference of 0.0%), Tohono O'odham (92.6%, a difference of 0.020%), Guyanese (92.7%, a difference of 0.040%), Immigrants from Dominica (92.7%, a difference of 0.060%), and Immigrants (92.5%, a difference of 0.10%).
| Demographics | Rating | Rank | 9th Grade |
| Haitians | 0.0 /100 | #298 | Tragic 93.1% |
| Immigrants | Grenada | 0.0 /100 | #299 | Tragic 93.0% |
| Yaqui | 0.0 /100 | #300 | Tragic 92.9% |
| Immigrants | Haiti | 0.0 /100 | #301 | Tragic 92.7% |
| Immigrants | Dominica | 0.0 /100 | #302 | Tragic 92.7% |
| Guyanese | 0.0 /100 | #303 | Tragic 92.7% |
| Tohono O'odham | 0.0 /100 | #304 | Tragic 92.6% |
| Japanese | 0.0 /100 | #305 | Tragic 92.6% |
| Immigrants | Vietnam | 0.0 /100 | #306 | Tragic 92.6% |
| Immigrants | Immigrants | 0.0 /100 | #307 | Tragic 92.5% |
| Immigrants | Guyana | 0.0 /100 | #308 | Tragic 92.5% |
| Immigrants | Bangladesh | 0.0 /100 | #309 | Tragic 92.4% |
| Immigrants | Cambodia | 0.0 /100 | #310 | Tragic 92.4% |
| Immigrants | Fiji | 0.0 /100 | #311 | Tragic 92.3% |
| Houma | 0.0 /100 | #312 | Tragic 92.3% |
Demographics Similar to Immigrants from Kazakhstan by 9th Grade
In terms of 9th grade, the demographic groups most similar to Immigrants from Kazakhstan are Arab (95.1%, a difference of 0.0%), Albanian (95.1%, a difference of 0.010%), Ugandan (95.1%, a difference of 0.020%), Immigrants from Kenya (95.0%, a difference of 0.020%), and Mongolian (95.0%, a difference of 0.020%).
| Demographics | Rating | Rank | 9th Grade |
| Immigrants | Jordan | 81.2 /100 | #148 | Excellent 95.1% |
| Immigrants | Korea | 79.6 /100 | #149 | Good 95.1% |
| Kenyans | 79.1 /100 | #150 | Good 95.1% |
| Cajuns | 77.3 /100 | #151 | Good 95.1% |
| Ugandans | 77.0 /100 | #152 | Good 95.1% |
| Albanians | 76.1 /100 | #153 | Good 95.1% |
| Arabs | 74.9 /100 | #154 | Good 95.1% |
| Immigrants | Kazakhstan | 74.7 /100 | #155 | Good 95.1% |
| Immigrants | Kenya | 73.1 /100 | #156 | Good 95.0% |
| Mongolians | 73.0 /100 | #157 | Good 95.0% |
| Egyptians | 70.1 /100 | #158 | Good 95.0% |
| Immigrants | Ukraine | 67.4 /100 | #159 | Good 95.0% |
| Immigrants | Italy | 66.6 /100 | #160 | Good 95.0% |
| French American Indians | 66.5 /100 | #161 | Good 95.0% |
| Bermudans | 65.8 /100 | #162 | Good 95.0% |