Jordanian vs Immigrants from Denmark 9th Grade
COMPARE
Jordanian
Immigrants from Denmark
9th Grade
9th Grade Comparison
Jordanians
Immigrants from Denmark
95.3%
9TH GRADE
93.5/ 100
METRIC RATING
130th/ 347
METRIC RANK
95.7%
9TH GRADE
99.1/ 100
METRIC RATING
84th/ 347
METRIC RANK
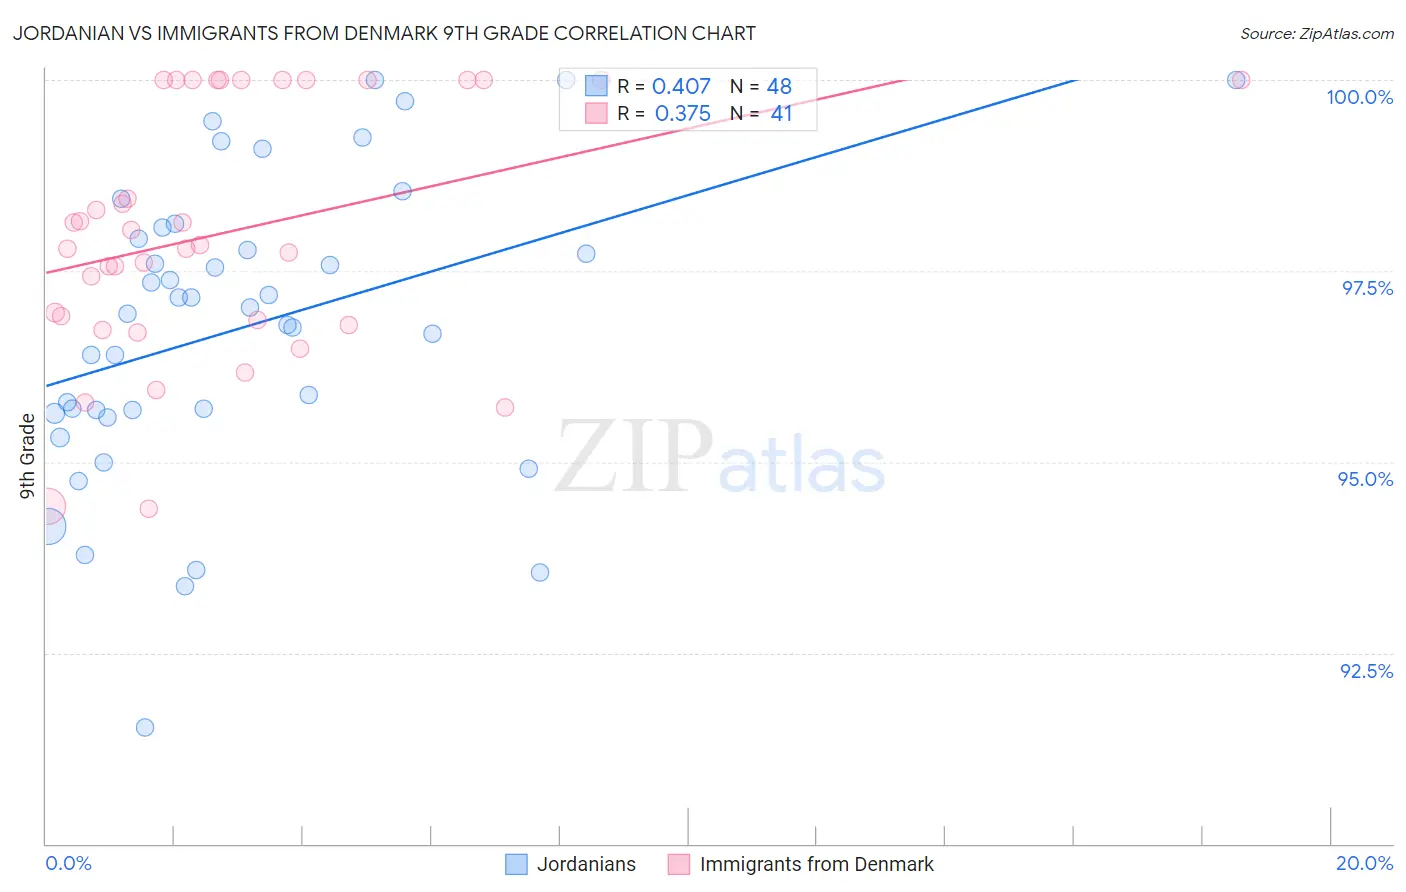
Jordanian vs Immigrants from Denmark 9th Grade Correlation Chart
The statistical analysis conducted on geographies consisting of 166,403,553 people shows a moderate positive correlation between the proportion of Jordanians and percentage of population with at least 9th grade education in the United States with a correlation coefficient (R) of 0.407 and weighted average of 95.3%. Similarly, the statistical analysis conducted on geographies consisting of 136,430,932 people shows a mild positive correlation between the proportion of Immigrants from Denmark and percentage of population with at least 9th grade education in the United States with a correlation coefficient (R) of 0.375 and weighted average of 95.7%, a difference of 0.38%.
9th Grade Correlation Summary
| Measurement | Jordanian | Immigrants from Denmark |
| Minimum | 91.5% | 94.4% |
| Maximum | 100.0% | 100.0% |
| Range | 8.5% | 5.6% |
| Mean | 96.8% | 98.0% |
| Median | 97.0% | 97.8% |
| Interquartile 25% (IQ1) | 95.7% | 96.8% |
| Interquartile 75% (IQ3) | 98.0% | 100.0% |
| Interquartile Range (IQR) | 2.3% | 3.2% |
| Standard Deviation (Sample) | 1.9% | 1.6% |
| Standard Deviation (Population) | 1.9% | 1.6% |
Similar Demographics by 9th Grade
Demographics Similar to Jordanians by 9th Grade
In terms of 9th grade, the demographic groups most similar to Jordanians are Palestinian (95.4%, a difference of 0.020%), Immigrants from Hungary (95.4%, a difference of 0.020%), Basque (95.4%, a difference of 0.020%), Immigrants from Serbia (95.4%, a difference of 0.030%), and Immigrants from North Macedonia (95.3%, a difference of 0.030%).
| Demographics | Rating | Rank | 9th Grade |
| Kiowa | 95.3 /100 | #123 | Exceptional 95.4% |
| Shoshone | 95.3 /100 | #124 | Exceptional 95.4% |
| Immigrants | South Central Asia | 95.1 /100 | #125 | Exceptional 95.4% |
| Immigrants | Serbia | 94.4 /100 | #126 | Exceptional 95.4% |
| Palestinians | 94.3 /100 | #127 | Exceptional 95.4% |
| Immigrants | Hungary | 94.2 /100 | #128 | Exceptional 95.4% |
| Basques | 94.1 /100 | #129 | Exceptional 95.4% |
| Jordanians | 93.5 /100 | #130 | Exceptional 95.3% |
| Immigrants | North Macedonia | 92.3 /100 | #131 | Exceptional 95.3% |
| Immigrants | Nonimmigrants | 92.0 /100 | #132 | Exceptional 95.3% |
| Israelis | 90.4 /100 | #133 | Exceptional 95.3% |
| Immigrants | Israel | 89.6 /100 | #134 | Excellent 95.3% |
| Immigrants | Belarus | 88.9 /100 | #135 | Excellent 95.2% |
| Immigrants | Iran | 88.3 /100 | #136 | Excellent 95.2% |
| Hmong | 87.7 /100 | #137 | Excellent 95.2% |
Demographics Similar to Immigrants from Denmark by 9th Grade
In terms of 9th grade, the demographic groups most similar to Immigrants from Denmark are Icelander (95.7%, a difference of 0.0%), Immigrants from Western Europe (95.7%, a difference of 0.0%), Swiss (95.7%, a difference of 0.010%), Puget Sound Salish (95.7%, a difference of 0.020%), and Bhutanese (95.7%, a difference of 0.030%).
| Demographics | Rating | Rank | 9th Grade |
| Whites/Caucasians | 99.4 /100 | #77 | Exceptional 95.8% |
| Immigrants | South Africa | 99.4 /100 | #78 | Exceptional 95.8% |
| Romanians | 99.3 /100 | #79 | Exceptional 95.7% |
| Bhutanese | 99.3 /100 | #80 | Exceptional 95.7% |
| Arapaho | 99.3 /100 | #81 | Exceptional 95.7% |
| Puget Sound Salish | 99.2 /100 | #82 | Exceptional 95.7% |
| Swiss | 99.2 /100 | #83 | Exceptional 95.7% |
| Immigrants | Denmark | 99.1 /100 | #84 | Exceptional 95.7% |
| Icelanders | 99.1 /100 | #85 | Exceptional 95.7% |
| Immigrants | Western Europe | 99.1 /100 | #86 | Exceptional 95.7% |
| Okinawans | 99.0 /100 | #87 | Exceptional 95.7% |
| Immigrants | Czechoslovakia | 98.9 /100 | #88 | Exceptional 95.7% |
| Yugoslavians | 98.9 /100 | #89 | Exceptional 95.7% |
| South Africans | 98.8 /100 | #90 | Exceptional 95.6% |
| Creek | 98.8 /100 | #91 | Exceptional 95.6% |