Uruguayan vs Immigrants from Denmark 9th Grade
COMPARE
Uruguayan
Immigrants from Denmark
9th Grade
9th Grade Comparison
Uruguayans
Immigrants from Denmark
94.1%
9TH GRADE
1.3/ 100
METRIC RATING
249th/ 347
METRIC RANK
95.7%
9TH GRADE
99.1/ 100
METRIC RATING
84th/ 347
METRIC RANK
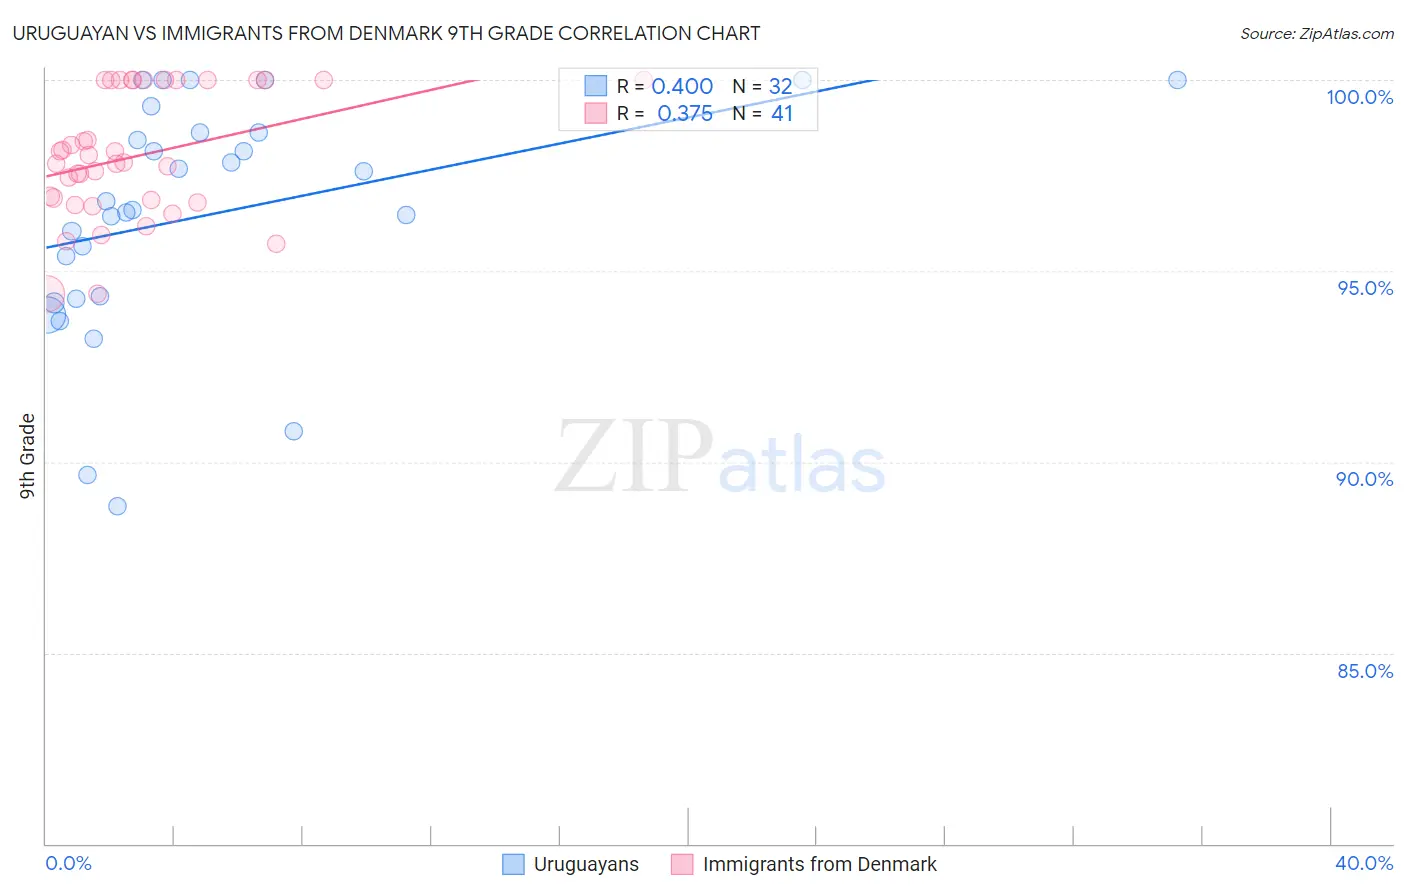
Uruguayan vs Immigrants from Denmark 9th Grade Correlation Chart
The statistical analysis conducted on geographies consisting of 144,782,794 people shows a mild positive correlation between the proportion of Uruguayans and percentage of population with at least 9th grade education in the United States with a correlation coefficient (R) of 0.400 and weighted average of 94.1%. Similarly, the statistical analysis conducted on geographies consisting of 136,430,932 people shows a mild positive correlation between the proportion of Immigrants from Denmark and percentage of population with at least 9th grade education in the United States with a correlation coefficient (R) of 0.375 and weighted average of 95.7%, a difference of 1.7%.
9th Grade Correlation Summary
| Measurement | Uruguayan | Immigrants from Denmark |
| Minimum | 88.8% | 94.4% |
| Maximum | 100.0% | 100.0% |
| Range | 11.2% | 5.6% |
| Mean | 96.5% | 98.0% |
| Median | 96.7% | 97.8% |
| Interquartile 25% (IQ1) | 94.3% | 96.8% |
| Interquartile 75% (IQ3) | 98.6% | 100.0% |
| Interquartile Range (IQR) | 4.3% | 3.2% |
| Standard Deviation (Sample) | 3.0% | 1.6% |
| Standard Deviation (Population) | 3.0% | 1.6% |
Similar Demographics by 9th Grade
Demographics Similar to Uruguayans by 9th Grade
In terms of 9th grade, the demographic groups most similar to Uruguayans are Immigrants from Hong Kong (94.1%, a difference of 0.0%), Immigrants from Somalia (94.1%, a difference of 0.010%), Afghan (94.2%, a difference of 0.060%), Jamaican (94.1%, a difference of 0.060%), and Paiute (94.2%, a difference of 0.070%).
| Demographics | Rating | Rank | 9th Grade |
| Immigrants | Middle Africa | 2.2 /100 | #242 | Tragic 94.2% |
| Immigrants | Cameroon | 2.1 /100 | #243 | Tragic 94.2% |
| Dutch West Indians | 2.0 /100 | #244 | Tragic 94.2% |
| Paiute | 1.9 /100 | #245 | Tragic 94.2% |
| Senegalese | 1.9 /100 | #246 | Tragic 94.2% |
| Afghans | 1.8 /100 | #247 | Tragic 94.2% |
| Immigrants | Somalia | 1.4 /100 | #248 | Tragic 94.1% |
| Uruguayans | 1.3 /100 | #249 | Tragic 94.1% |
| Immigrants | Hong Kong | 1.3 /100 | #250 | Tragic 94.1% |
| Jamaicans | 1.0 /100 | #251 | Tragic 94.1% |
| Immigrants | Senegal | 0.9 /100 | #252 | Tragic 94.1% |
| Colombians | 0.8 /100 | #253 | Tragic 94.0% |
| U.S. Virgin Islanders | 0.7 /100 | #254 | Tragic 94.0% |
| Immigrants | Nigeria | 0.6 /100 | #255 | Tragic 94.0% |
| Immigrants | Afghanistan | 0.5 /100 | #256 | Tragic 94.0% |
Demographics Similar to Immigrants from Denmark by 9th Grade
In terms of 9th grade, the demographic groups most similar to Immigrants from Denmark are Icelander (95.7%, a difference of 0.0%), Immigrants from Western Europe (95.7%, a difference of 0.0%), Swiss (95.7%, a difference of 0.010%), Puget Sound Salish (95.7%, a difference of 0.020%), and Bhutanese (95.7%, a difference of 0.030%).
| Demographics | Rating | Rank | 9th Grade |
| Whites/Caucasians | 99.4 /100 | #77 | Exceptional 95.8% |
| Immigrants | South Africa | 99.4 /100 | #78 | Exceptional 95.8% |
| Romanians | 99.3 /100 | #79 | Exceptional 95.7% |
| Bhutanese | 99.3 /100 | #80 | Exceptional 95.7% |
| Arapaho | 99.3 /100 | #81 | Exceptional 95.7% |
| Puget Sound Salish | 99.2 /100 | #82 | Exceptional 95.7% |
| Swiss | 99.2 /100 | #83 | Exceptional 95.7% |
| Immigrants | Denmark | 99.1 /100 | #84 | Exceptional 95.7% |
| Icelanders | 99.1 /100 | #85 | Exceptional 95.7% |
| Immigrants | Western Europe | 99.1 /100 | #86 | Exceptional 95.7% |
| Okinawans | 99.0 /100 | #87 | Exceptional 95.7% |
| Immigrants | Czechoslovakia | 98.9 /100 | #88 | Exceptional 95.7% |
| Yugoslavians | 98.9 /100 | #89 | Exceptional 95.7% |
| South Africans | 98.8 /100 | #90 | Exceptional 95.6% |
| Creek | 98.8 /100 | #91 | Exceptional 95.6% |