Japanese vs Iraqi 9th Grade
COMPARE
Japanese
Iraqi
9th Grade
9th Grade Comparison
Japanese
Iraqis
92.6%
9TH GRADE
0.0/ 100
METRIC RATING
305th/ 347
METRIC RANK
94.9%
9TH GRADE
54.0/ 100
METRIC RATING
172nd/ 347
METRIC RANK
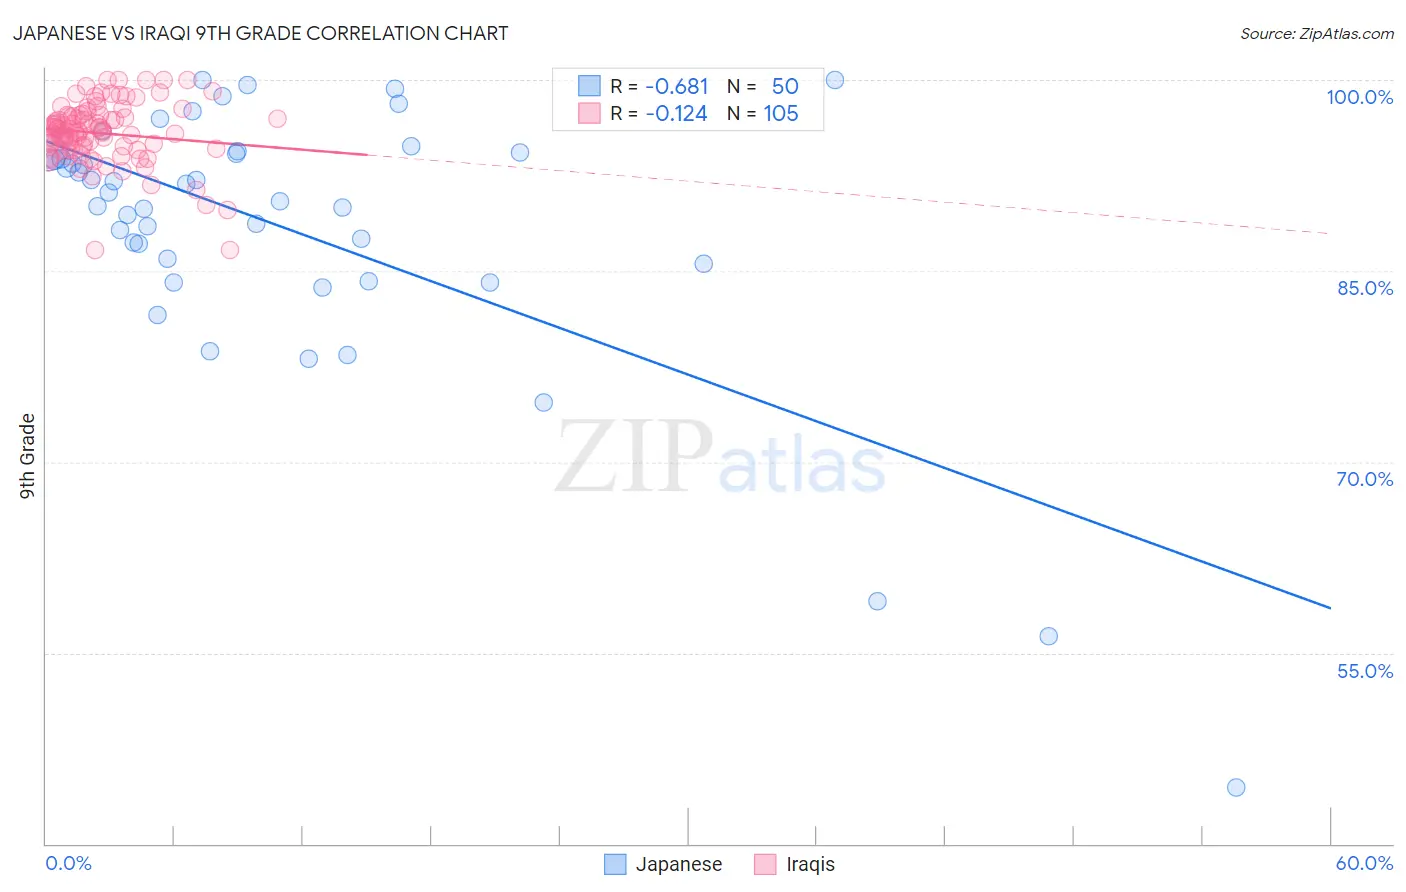
Japanese vs Iraqi 9th Grade Correlation Chart
The statistical analysis conducted on geographies consisting of 249,183,224 people shows a significant negative correlation between the proportion of Japanese and percentage of population with at least 9th grade education in the United States with a correlation coefficient (R) of -0.681 and weighted average of 92.6%. Similarly, the statistical analysis conducted on geographies consisting of 170,614,457 people shows a poor negative correlation between the proportion of Iraqis and percentage of population with at least 9th grade education in the United States with a correlation coefficient (R) of -0.124 and weighted average of 94.9%, a difference of 2.5%.
9th Grade Correlation Summary
| Measurement | Japanese | Iraqi |
| Minimum | 44.4% | 86.6% |
| Maximum | 100.0% | 100.0% |
| Range | 55.6% | 13.4% |
| Mean | 88.3% | 95.8% |
| Median | 90.8% | 95.9% |
| Interquartile 25% (IQ1) | 85.6% | 94.6% |
| Interquartile 75% (IQ3) | 94.3% | 97.2% |
| Interquartile Range (IQR) | 8.7% | 2.6% |
| Standard Deviation (Sample) | 10.9% | 2.4% |
| Standard Deviation (Population) | 10.8% | 2.4% |
Similar Demographics by 9th Grade
Demographics Similar to Japanese by 9th Grade
In terms of 9th grade, the demographic groups most similar to Japanese are Immigrants from Vietnam (92.6%, a difference of 0.0%), Tohono O'odham (92.6%, a difference of 0.020%), Guyanese (92.7%, a difference of 0.040%), Immigrants from Dominica (92.7%, a difference of 0.060%), and Immigrants (92.5%, a difference of 0.10%).
| Demographics | Rating | Rank | 9th Grade |
| Haitians | 0.0 /100 | #298 | Tragic 93.1% |
| Immigrants | Grenada | 0.0 /100 | #299 | Tragic 93.0% |
| Yaqui | 0.0 /100 | #300 | Tragic 92.9% |
| Immigrants | Haiti | 0.0 /100 | #301 | Tragic 92.7% |
| Immigrants | Dominica | 0.0 /100 | #302 | Tragic 92.7% |
| Guyanese | 0.0 /100 | #303 | Tragic 92.7% |
| Tohono O'odham | 0.0 /100 | #304 | Tragic 92.6% |
| Japanese | 0.0 /100 | #305 | Tragic 92.6% |
| Immigrants | Vietnam | 0.0 /100 | #306 | Tragic 92.6% |
| Immigrants | Immigrants | 0.0 /100 | #307 | Tragic 92.5% |
| Immigrants | Guyana | 0.0 /100 | #308 | Tragic 92.5% |
| Immigrants | Bangladesh | 0.0 /100 | #309 | Tragic 92.4% |
| Immigrants | Cambodia | 0.0 /100 | #310 | Tragic 92.4% |
| Immigrants | Fiji | 0.0 /100 | #311 | Tragic 92.3% |
| Houma | 0.0 /100 | #312 | Tragic 92.3% |
Demographics Similar to Iraqis by 9th Grade
In terms of 9th grade, the demographic groups most similar to Iraqis are Cheyenne (94.9%, a difference of 0.020%), Alsatian (94.9%, a difference of 0.030%), Colville (94.9%, a difference of 0.030%), Immigrants from Egypt (94.9%, a difference of 0.030%), and Brazilian (94.9%, a difference of 0.030%).
| Demographics | Rating | Rank | 9th Grade |
| Blackfeet | 62.6 /100 | #165 | Good 95.0% |
| Ute | 62.6 /100 | #166 | Good 95.0% |
| Immigrants | Brazil | 61.1 /100 | #167 | Good 95.0% |
| Chileans | 60.7 /100 | #168 | Good 95.0% |
| Spaniards | 59.6 /100 | #169 | Average 94.9% |
| Alsatians | 58.6 /100 | #170 | Average 94.9% |
| Colville | 58.5 /100 | #171 | Average 94.9% |
| Iraqis | 54.0 /100 | #172 | Average 94.9% |
| Cheyenne | 51.5 /100 | #173 | Average 94.9% |
| Immigrants | Egypt | 50.0 /100 | #174 | Average 94.9% |
| Brazilians | 49.8 /100 | #175 | Average 94.9% |
| Immigrants | Spain | 49.1 /100 | #176 | Average 94.9% |
| Immigrants | Iraq | 47.8 /100 | #177 | Average 94.9% |
| Immigrants | Poland | 46.7 /100 | #178 | Average 94.9% |
| Immigrants | Venezuela | 46.5 /100 | #179 | Average 94.9% |