British West Indian vs Immigrants from Switzerland GED/Equivalency
COMPARE
British West Indian
Immigrants from Switzerland
GED/Equivalency
GED/Equivalency Comparison
British West Indians
Immigrants from Switzerland
82.0%
GED/EQUIVALENCY
0.0/ 100
METRIC RATING
293rd/ 347
METRIC RANK
88.1%
GED/EQUIVALENCY
99.5/ 100
METRIC RATING
46th/ 347
METRIC RANK
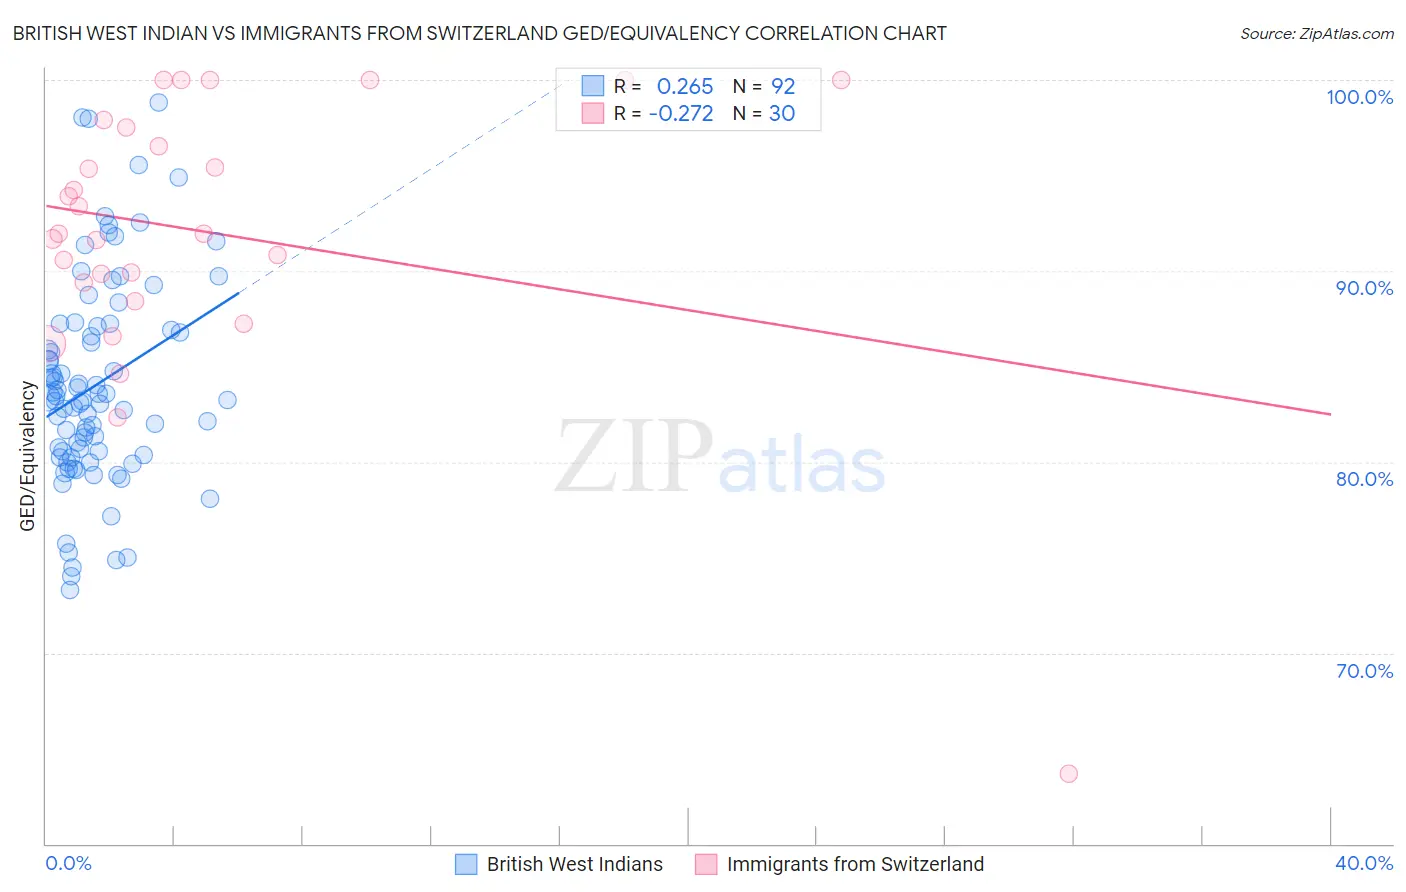
British West Indian vs Immigrants from Switzerland GED/Equivalency Correlation Chart
The statistical analysis conducted on geographies consisting of 152,614,591 people shows a weak positive correlation between the proportion of British West Indians and percentage of population with at least ged/equivalency education in the United States with a correlation coefficient (R) of 0.265 and weighted average of 82.0%. Similarly, the statistical analysis conducted on geographies consisting of 148,083,583 people shows a weak negative correlation between the proportion of Immigrants from Switzerland and percentage of population with at least ged/equivalency education in the United States with a correlation coefficient (R) of -0.272 and weighted average of 88.1%, a difference of 7.4%.
GED/Equivalency Correlation Summary
| Measurement | British West Indian | Immigrants from Switzerland |
| Minimum | 73.3% | 63.6% |
| Maximum | 98.8% | 100.0% |
| Range | 25.5% | 36.4% |
| Mean | 84.1% | 92.0% |
| Median | 83.3% | 92.0% |
| Interquartile 25% (IQ1) | 80.4% | 89.4% |
| Interquartile 75% (IQ3) | 87.0% | 97.5% |
| Interquartile Range (IQR) | 6.6% | 8.2% |
| Standard Deviation (Sample) | 5.4% | 7.4% |
| Standard Deviation (Population) | 5.4% | 7.2% |
Similar Demographics by GED/Equivalency
Demographics Similar to British West Indians by GED/Equivalency
In terms of ged/equivalency, the demographic groups most similar to British West Indians are Paiute (82.0%, a difference of 0.010%), Immigrants from St. Vincent and the Grenadines (82.0%, a difference of 0.030%), Cuban (82.0%, a difference of 0.040%), Haitian (82.1%, a difference of 0.070%), and Nepalese (81.9%, a difference of 0.080%).
| Demographics | Rating | Rank | GED/Equivalency |
| Immigrants | West Indies | 0.0 /100 | #286 | Tragic 82.4% |
| Japanese | 0.0 /100 | #287 | Tragic 82.4% |
| Pueblo | 0.0 /100 | #288 | Tragic 82.3% |
| Immigrants | Cambodia | 0.0 /100 | #289 | Tragic 82.2% |
| Haitians | 0.0 /100 | #290 | Tragic 82.1% |
| Cubans | 0.0 /100 | #291 | Tragic 82.0% |
| Paiute | 0.0 /100 | #292 | Tragic 82.0% |
| British West Indians | 0.0 /100 | #293 | Tragic 82.0% |
| Immigrants | St. Vincent and the Grenadines | 0.0 /100 | #294 | Tragic 82.0% |
| Nepalese | 0.0 /100 | #295 | Tragic 81.9% |
| Vietnamese | 0.0 /100 | #296 | Tragic 81.9% |
| Immigrants | Bangladesh | 0.0 /100 | #297 | Tragic 81.9% |
| Ute | 0.0 /100 | #298 | Tragic 81.8% |
| Ecuadorians | 0.0 /100 | #299 | Tragic 81.7% |
| Fijians | 0.0 /100 | #300 | Tragic 81.6% |
Demographics Similar to Immigrants from Switzerland by GED/Equivalency
In terms of ged/equivalency, the demographic groups most similar to Immigrants from Switzerland are Immigrants from Latvia (88.1%, a difference of 0.010%), Czech (88.1%, a difference of 0.020%), Greek (88.1%, a difference of 0.020%), Australian (88.1%, a difference of 0.030%), and Immigrants from Korea (88.1%, a difference of 0.040%).
| Demographics | Rating | Rank | GED/Equivalency |
| Immigrants | Israel | 99.6 /100 | #39 | Exceptional 88.2% |
| Italians | 99.6 /100 | #40 | Exceptional 88.2% |
| Finns | 99.6 /100 | #41 | Exceptional 88.2% |
| Cambodians | 99.6 /100 | #42 | Exceptional 88.2% |
| Immigrants | Scotland | 99.6 /100 | #43 | Exceptional 88.2% |
| Macedonians | 99.5 /100 | #44 | Exceptional 88.1% |
| Czechs | 99.5 /100 | #45 | Exceptional 88.1% |
| Immigrants | Switzerland | 99.5 /100 | #46 | Exceptional 88.1% |
| Immigrants | Latvia | 99.5 /100 | #47 | Exceptional 88.1% |
| Greeks | 99.5 /100 | #48 | Exceptional 88.1% |
| Australians | 99.5 /100 | #49 | Exceptional 88.1% |
| Immigrants | Korea | 99.5 /100 | #50 | Exceptional 88.1% |
| Immigrants | Netherlands | 99.4 /100 | #51 | Exceptional 88.0% |
| Zimbabweans | 99.4 /100 | #52 | Exceptional 88.0% |
| Immigrants | South Africa | 99.4 /100 | #53 | Exceptional 88.0% |