Jamaican vs Immigrants from Philippines Associate's Degree
COMPARE
Jamaican
Immigrants from Philippines
Associate's Degree
Associate's Degree Comparison
Jamaicans
Immigrants from Philippines
42.1%
ASSOCIATE'S DEGREE
0.7/ 100
METRIC RATING
249th/ 347
METRIC RANK
45.0%
ASSOCIATE'S DEGREE
16.7/ 100
METRIC RATING
210th/ 347
METRIC RANK
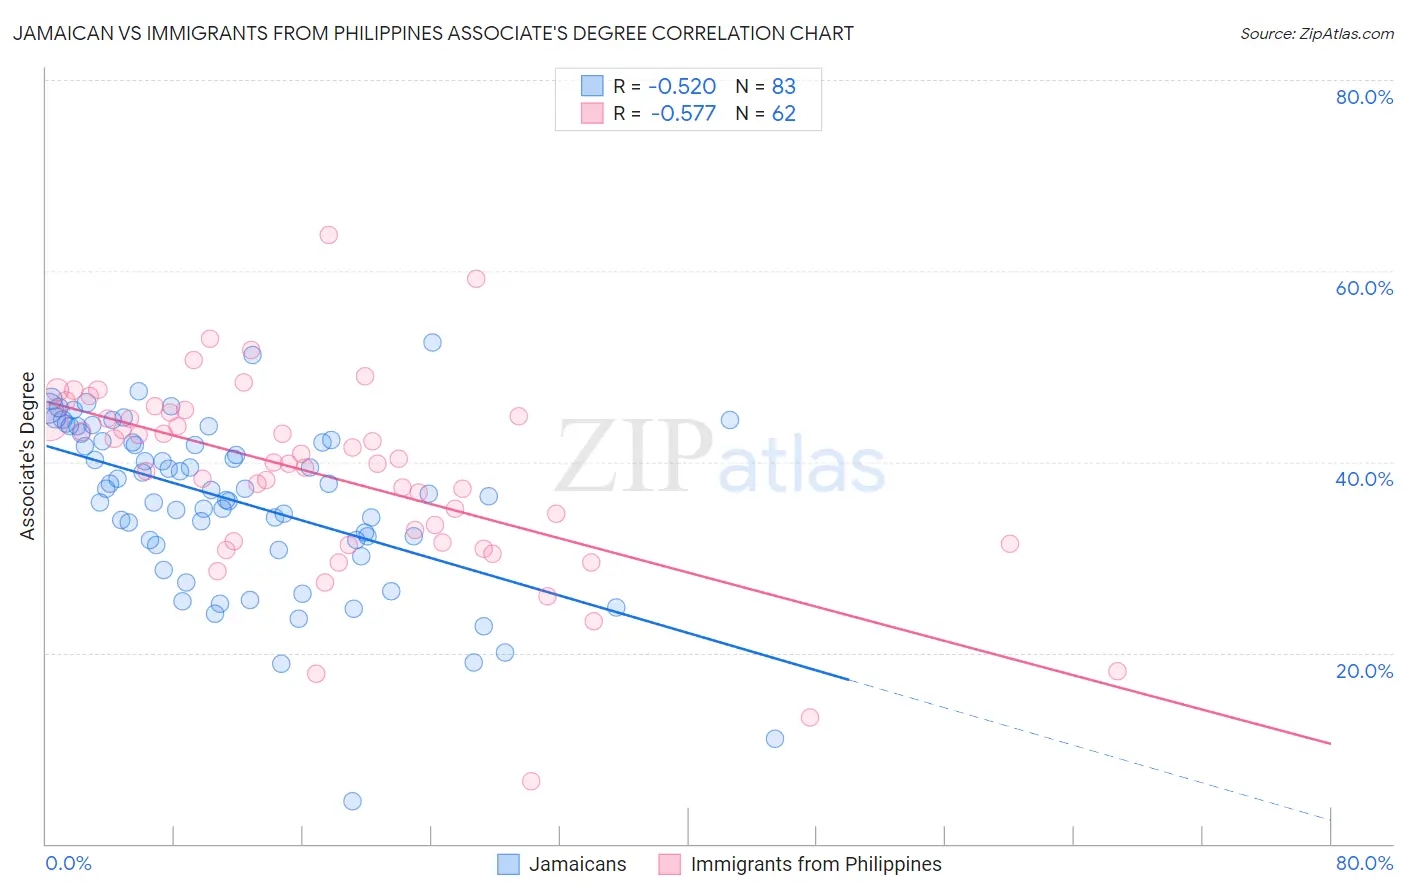
Jamaican vs Immigrants from Philippines Associate's Degree Correlation Chart
The statistical analysis conducted on geographies consisting of 368,030,405 people shows a substantial negative correlation between the proportion of Jamaicans and percentage of population with at least associate's degree education in the United States with a correlation coefficient (R) of -0.520 and weighted average of 42.1%. Similarly, the statistical analysis conducted on geographies consisting of 471,293,410 people shows a substantial negative correlation between the proportion of Immigrants from Philippines and percentage of population with at least associate's degree education in the United States with a correlation coefficient (R) of -0.577 and weighted average of 45.0%, a difference of 6.8%.
Associate's Degree Correlation Summary
| Measurement | Jamaican | Immigrants from Philippines |
| Minimum | 4.5% | 6.5% |
| Maximum | 52.5% | 63.7% |
| Range | 48.0% | 57.2% |
| Mean | 36.0% | 38.5% |
| Median | 37.1% | 39.9% |
| Interquartile 25% (IQ1) | 31.8% | 31.5% |
| Interquartile 75% (IQ3) | 42.2% | 44.8% |
| Interquartile Range (IQR) | 10.4% | 13.3% |
| Standard Deviation (Sample) | 8.8% | 10.2% |
| Standard Deviation (Population) | 8.8% | 10.2% |
Similar Demographics by Associate's Degree
Demographics Similar to Jamaicans by Associate's Degree
In terms of associate's degree, the demographic groups most similar to Jamaicans are U.S. Virgin Islander (42.1%, a difference of 0.010%), Immigrants from Bahamas (42.1%, a difference of 0.030%), Immigrants from Ecuador (42.2%, a difference of 0.14%), Immigrants from Fiji (42.2%, a difference of 0.23%), and Delaware (42.3%, a difference of 0.32%).
| Demographics | Rating | Rank | Associate's Degree |
| Immigrants | West Indies | 1.0 /100 | #242 | Tragic 42.4% |
| Guyanese | 1.0 /100 | #243 | Tragic 42.3% |
| Immigrants | Liberia | 0.9 /100 | #244 | Tragic 42.3% |
| Immigrants | Cambodia | 0.9 /100 | #245 | Tragic 42.3% |
| Delaware | 0.9 /100 | #246 | Tragic 42.3% |
| Immigrants | Fiji | 0.8 /100 | #247 | Tragic 42.2% |
| Immigrants | Ecuador | 0.8 /100 | #248 | Tragic 42.2% |
| Jamaicans | 0.7 /100 | #249 | Tragic 42.1% |
| U.S. Virgin Islanders | 0.7 /100 | #250 | Tragic 42.1% |
| Immigrants | Bahamas | 0.7 /100 | #251 | Tragic 42.1% |
| French American Indians | 0.6 /100 | #252 | Tragic 42.0% |
| Indonesians | 0.6 /100 | #253 | Tragic 41.9% |
| Cubans | 0.6 /100 | #254 | Tragic 41.9% |
| Immigrants | Guyana | 0.5 /100 | #255 | Tragic 41.8% |
| Immigrants | Congo | 0.5 /100 | #256 | Tragic 41.8% |
Demographics Similar to Immigrants from Philippines by Associate's Degree
In terms of associate's degree, the demographic groups most similar to Immigrants from Philippines are Immigrants from Costa Rica (45.0%, a difference of 0.010%), Immigrants from Zaire (45.0%, a difference of 0.010%), Dutch (45.0%, a difference of 0.12%), Panamanian (45.1%, a difference of 0.22%), and French Canadian (44.9%, a difference of 0.24%).
| Demographics | Rating | Rank | Associate's Degree |
| Immigrants | South Eastern Asia | 20.2 /100 | #203 | Fair 45.2% |
| Nigerians | 19.1 /100 | #204 | Poor 45.1% |
| Immigrants | Thailand | 18.9 /100 | #205 | Poor 45.1% |
| German Russians | 18.9 /100 | #206 | Poor 45.1% |
| Panamanians | 18.4 /100 | #207 | Poor 45.1% |
| Dutch | 17.6 /100 | #208 | Poor 45.0% |
| Immigrants | Costa Rica | 16.7 /100 | #209 | Poor 45.0% |
| Immigrants | Philippines | 16.7 /100 | #210 | Poor 45.0% |
| Immigrants | Zaire | 16.6 /100 | #211 | Poor 45.0% |
| French Canadians | 15.0 /100 | #212 | Poor 44.9% |
| Immigrants | Ghana | 14.2 /100 | #213 | Poor 44.8% |
| Immigrants | Middle Africa | 12.7 /100 | #214 | Poor 44.7% |
| Immigrants | Panama | 12.4 /100 | #215 | Poor 44.7% |
| Immigrants | Nigeria | 11.4 /100 | #216 | Poor 44.6% |
| Immigrants | Immigrants | 10.5 /100 | #217 | Poor 44.5% |