Jamaican vs Immigrants from Asia Associate's Degree
COMPARE
Jamaican
Immigrants from Asia
Associate's Degree
Associate's Degree Comparison
Jamaicans
Immigrants from Asia
42.1%
ASSOCIATE'S DEGREE
0.7/ 100
METRIC RATING
249th/ 347
METRIC RANK
52.0%
ASSOCIATE'S DEGREE
99.8/ 100
METRIC RATING
53rd/ 347
METRIC RANK
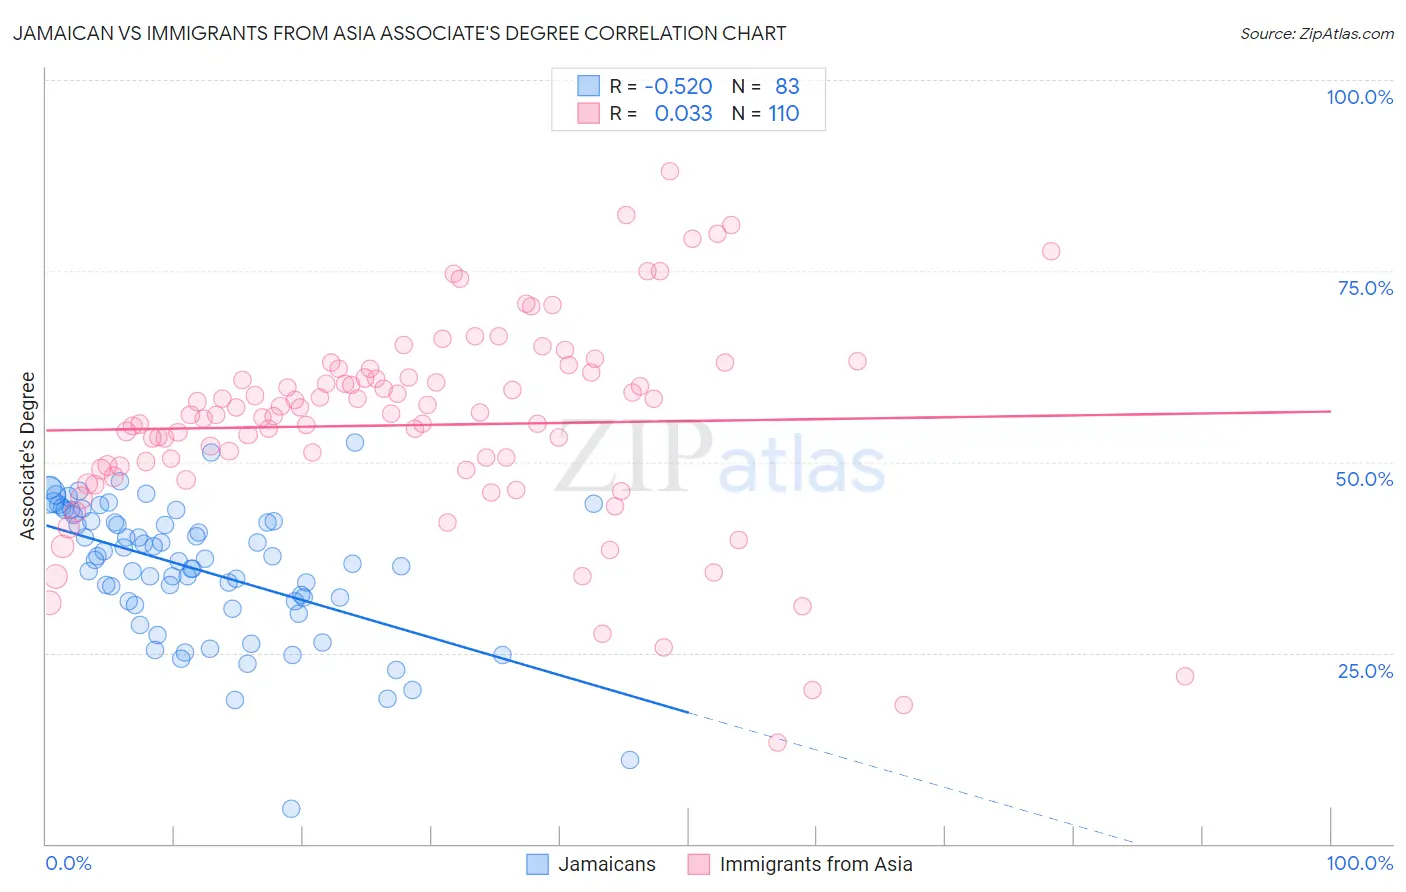
Jamaican vs Immigrants from Asia Associate's Degree Correlation Chart
The statistical analysis conducted on geographies consisting of 368,030,405 people shows a substantial negative correlation between the proportion of Jamaicans and percentage of population with at least associate's degree education in the United States with a correlation coefficient (R) of -0.520 and weighted average of 42.1%. Similarly, the statistical analysis conducted on geographies consisting of 549,095,102 people shows no correlation between the proportion of Immigrants from Asia and percentage of population with at least associate's degree education in the United States with a correlation coefficient (R) of 0.033 and weighted average of 52.0%, a difference of 23.4%.
Associate's Degree Correlation Summary
| Measurement | Jamaican | Immigrants from Asia |
| Minimum | 4.5% | 13.2% |
| Maximum | 52.5% | 88.0% |
| Range | 48.0% | 74.8% |
| Mean | 36.0% | 54.8% |
| Median | 37.1% | 56.2% |
| Interquartile 25% (IQ1) | 31.8% | 49.0% |
| Interquartile 75% (IQ3) | 42.2% | 61.1% |
| Interquartile Range (IQR) | 10.4% | 12.0% |
| Standard Deviation (Sample) | 8.8% | 13.4% |
| Standard Deviation (Population) | 8.8% | 13.4% |
Similar Demographics by Associate's Degree
Demographics Similar to Jamaicans by Associate's Degree
In terms of associate's degree, the demographic groups most similar to Jamaicans are U.S. Virgin Islander (42.1%, a difference of 0.010%), Immigrants from Bahamas (42.1%, a difference of 0.030%), Immigrants from Ecuador (42.2%, a difference of 0.14%), Immigrants from Fiji (42.2%, a difference of 0.23%), and Delaware (42.3%, a difference of 0.32%).
| Demographics | Rating | Rank | Associate's Degree |
| Immigrants | West Indies | 1.0 /100 | #242 | Tragic 42.4% |
| Guyanese | 1.0 /100 | #243 | Tragic 42.3% |
| Immigrants | Liberia | 0.9 /100 | #244 | Tragic 42.3% |
| Immigrants | Cambodia | 0.9 /100 | #245 | Tragic 42.3% |
| Delaware | 0.9 /100 | #246 | Tragic 42.3% |
| Immigrants | Fiji | 0.8 /100 | #247 | Tragic 42.2% |
| Immigrants | Ecuador | 0.8 /100 | #248 | Tragic 42.2% |
| Jamaicans | 0.7 /100 | #249 | Tragic 42.1% |
| U.S. Virgin Islanders | 0.7 /100 | #250 | Tragic 42.1% |
| Immigrants | Bahamas | 0.7 /100 | #251 | Tragic 42.1% |
| French American Indians | 0.6 /100 | #252 | Tragic 42.0% |
| Indonesians | 0.6 /100 | #253 | Tragic 41.9% |
| Cubans | 0.6 /100 | #254 | Tragic 41.9% |
| Immigrants | Guyana | 0.5 /100 | #255 | Tragic 41.8% |
| Immigrants | Congo | 0.5 /100 | #256 | Tragic 41.8% |
Demographics Similar to Immigrants from Asia by Associate's Degree
In terms of associate's degree, the demographic groups most similar to Immigrants from Asia are Bolivian (52.0%, a difference of 0.020%), Immigrants from Spain (51.9%, a difference of 0.10%), Australian (51.9%, a difference of 0.13%), Immigrants from Czechoslovakia (51.9%, a difference of 0.15%), and Immigrants from Greece (52.1%, a difference of 0.23%).
| Demographics | Rating | Rank | Associate's Degree |
| Immigrants | Bulgaria | 99.9 /100 | #46 | Exceptional 52.4% |
| Immigrants | Kuwait | 99.9 /100 | #47 | Exceptional 52.4% |
| Immigrants | Norway | 99.9 /100 | #48 | Exceptional 52.2% |
| Immigrants | Austria | 99.9 /100 | #49 | Exceptional 52.1% |
| Asians | 99.9 /100 | #50 | Exceptional 52.1% |
| Immigrants | Greece | 99.9 /100 | #51 | Exceptional 52.1% |
| Bolivians | 99.8 /100 | #52 | Exceptional 52.0% |
| Immigrants | Asia | 99.8 /100 | #53 | Exceptional 52.0% |
| Immigrants | Spain | 99.8 /100 | #54 | Exceptional 51.9% |
| Australians | 99.8 /100 | #55 | Exceptional 51.9% |
| Immigrants | Czechoslovakia | 99.8 /100 | #56 | Exceptional 51.9% |
| Paraguayans | 99.8 /100 | #57 | Exceptional 51.8% |
| New Zealanders | 99.8 /100 | #58 | Exceptional 51.8% |
| Immigrants | Serbia | 99.8 /100 | #59 | Exceptional 51.7% |
| Immigrants | Bolivia | 99.7 /100 | #60 | Exceptional 51.5% |