Israeli vs Comanche Master's Degree
COMPARE
Israeli
Comanche
Master's Degree
Master's Degree Comparison
Israelis
Comanche
20.3%
MASTER'S DEGREE
100.0/ 100
METRIC RATING
22nd/ 347
METRIC RANK
12.1%
MASTER'S DEGREE
0.3/ 100
METRIC RATING
272nd/ 347
METRIC RANK
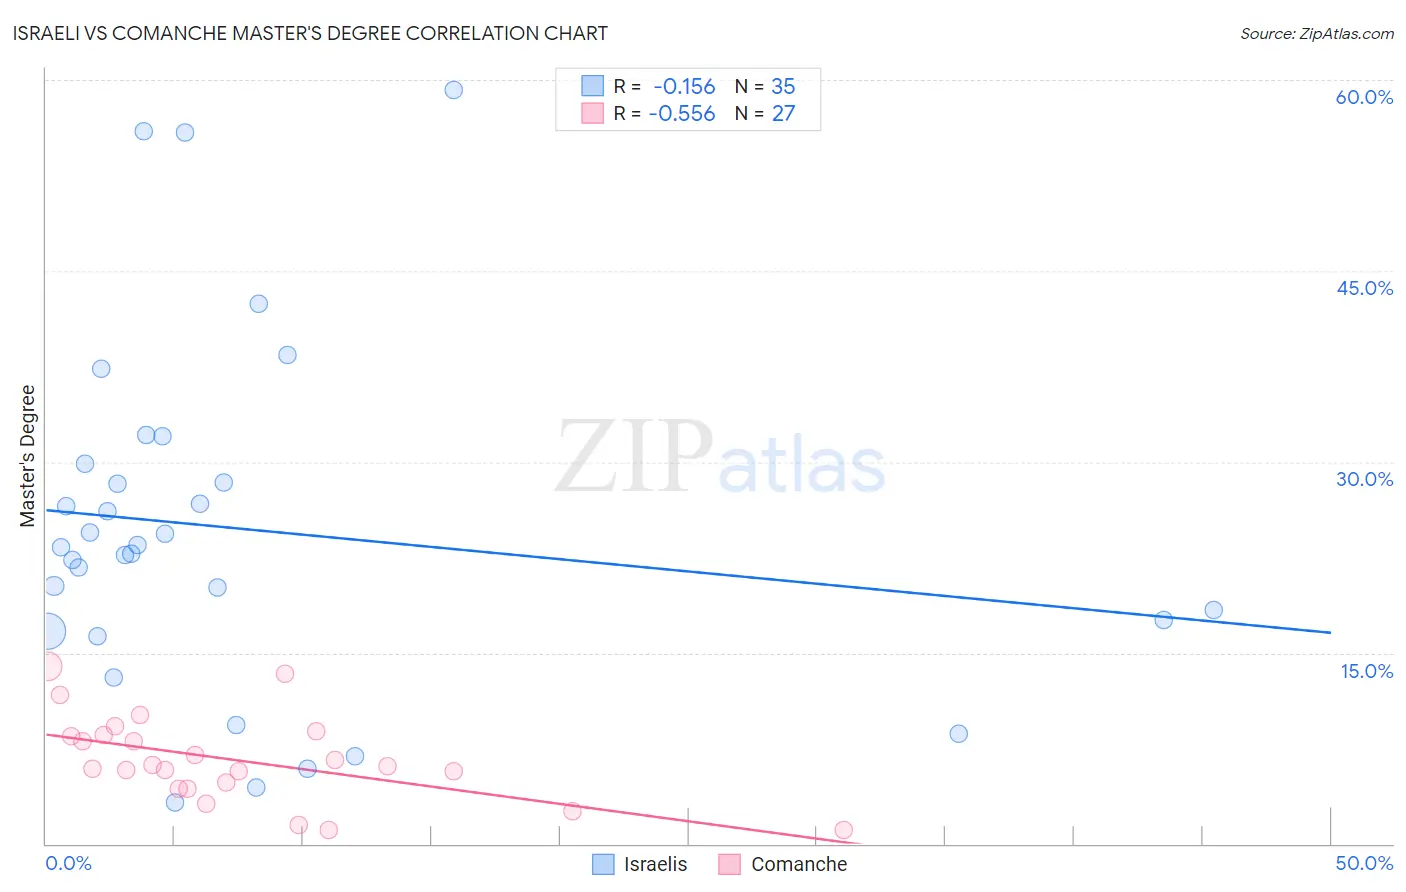
Israeli vs Comanche Master's Degree Correlation Chart
The statistical analysis conducted on geographies consisting of 211,131,712 people shows a poor negative correlation between the proportion of Israelis and percentage of population with at least master's degree education in the United States with a correlation coefficient (R) of -0.156 and weighted average of 20.3%. Similarly, the statistical analysis conducted on geographies consisting of 109,770,893 people shows a substantial negative correlation between the proportion of Comanche and percentage of population with at least master's degree education in the United States with a correlation coefficient (R) of -0.556 and weighted average of 12.1%, a difference of 68.1%.
Master's Degree Correlation Summary
| Measurement | Israeli | Comanche |
| Minimum | 3.2% | 1.0% |
| Maximum | 59.3% | 13.9% |
| Range | 56.0% | 12.9% |
| Mean | 24.7% | 6.6% |
| Median | 23.3% | 6.1% |
| Interquartile 25% (IQ1) | 16.7% | 4.3% |
| Interquartile 75% (IQ3) | 29.9% | 8.6% |
| Interquartile Range (IQR) | 13.2% | 4.3% |
| Standard Deviation (Sample) | 13.8% | 3.4% |
| Standard Deviation (Population) | 13.6% | 3.3% |
Similar Demographics by Master's Degree
Demographics Similar to Israelis by Master's Degree
In terms of master's degree, the demographic groups most similar to Israelis are Immigrants from France (20.3%, a difference of 0.28%), Immigrants from Sweden (20.3%, a difference of 0.35%), Immigrants from Ireland (20.4%, a difference of 0.42%), Indian (Asian) (20.5%, a difference of 0.53%), and Immigrants from Hong Kong (20.5%, a difference of 0.55%).
| Demographics | Rating | Rank | Master's Degree |
| Immigrants | Eastern Asia | 100.0 /100 | #15 | Exceptional 20.8% |
| Immigrants | Belgium | 100.0 /100 | #16 | Exceptional 20.8% |
| Immigrants | South Central Asia | 100.0 /100 | #17 | Exceptional 20.7% |
| Soviet Union | 100.0 /100 | #18 | Exceptional 20.5% |
| Immigrants | Hong Kong | 100.0 /100 | #19 | Exceptional 20.5% |
| Indians (Asian) | 100.0 /100 | #20 | Exceptional 20.5% |
| Immigrants | Ireland | 100.0 /100 | #21 | Exceptional 20.4% |
| Israelis | 100.0 /100 | #22 | Exceptional 20.3% |
| Immigrants | France | 100.0 /100 | #23 | Exceptional 20.3% |
| Immigrants | Sweden | 100.0 /100 | #24 | Exceptional 20.3% |
| Immigrants | Japan | 100.0 /100 | #25 | Exceptional 20.0% |
| Cambodians | 100.0 /100 | #26 | Exceptional 20.0% |
| Immigrants | Sri Lanka | 100.0 /100 | #27 | Exceptional 19.9% |
| Turks | 100.0 /100 | #28 | Exceptional 19.9% |
| Latvians | 100.0 /100 | #29 | Exceptional 19.8% |
Demographics Similar to Comanche by Master's Degree
In terms of master's degree, the demographic groups most similar to Comanche are Haitian (12.1%, a difference of 0.060%), Blackfeet (12.1%, a difference of 0.090%), Cape Verdean (12.1%, a difference of 0.18%), Cuban (12.1%, a difference of 0.20%), and Black/African American (12.1%, a difference of 0.25%).
| Demographics | Rating | Rank | Master's Degree |
| Immigrants | Fiji | 0.5 /100 | #265 | Tragic 12.4% |
| Bahamians | 0.5 /100 | #266 | Tragic 12.4% |
| Americans | 0.4 /100 | #267 | Tragic 12.3% |
| Native Hawaiians | 0.4 /100 | #268 | Tragic 12.3% |
| Central Americans | 0.3 /100 | #269 | Tragic 12.2% |
| Salvadorans | 0.3 /100 | #270 | Tragic 12.2% |
| Haitians | 0.3 /100 | #271 | Tragic 12.1% |
| Comanche | 0.3 /100 | #272 | Tragic 12.1% |
| Blackfeet | 0.3 /100 | #273 | Tragic 12.1% |
| Cape Verdeans | 0.3 /100 | #274 | Tragic 12.1% |
| Cubans | 0.3 /100 | #275 | Tragic 12.1% |
| Blacks/African Americans | 0.3 /100 | #276 | Tragic 12.1% |
| Immigrants | Caribbean | 0.3 /100 | #277 | Tragic 12.1% |
| Potawatomi | 0.3 /100 | #278 | Tragic 12.1% |
| Immigrants | Belize | 0.2 /100 | #279 | Tragic 12.1% |