Israeli vs Immigrants from Micronesia Master's Degree
COMPARE
Israeli
Immigrants from Micronesia
Master's Degree
Master's Degree Comparison
Israelis
Immigrants from Micronesia
20.3%
MASTER'S DEGREE
100.0/ 100
METRIC RATING
22nd/ 347
METRIC RANK
10.8%
MASTER'S DEGREE
0.0/ 100
METRIC RATING
320th/ 347
METRIC RANK
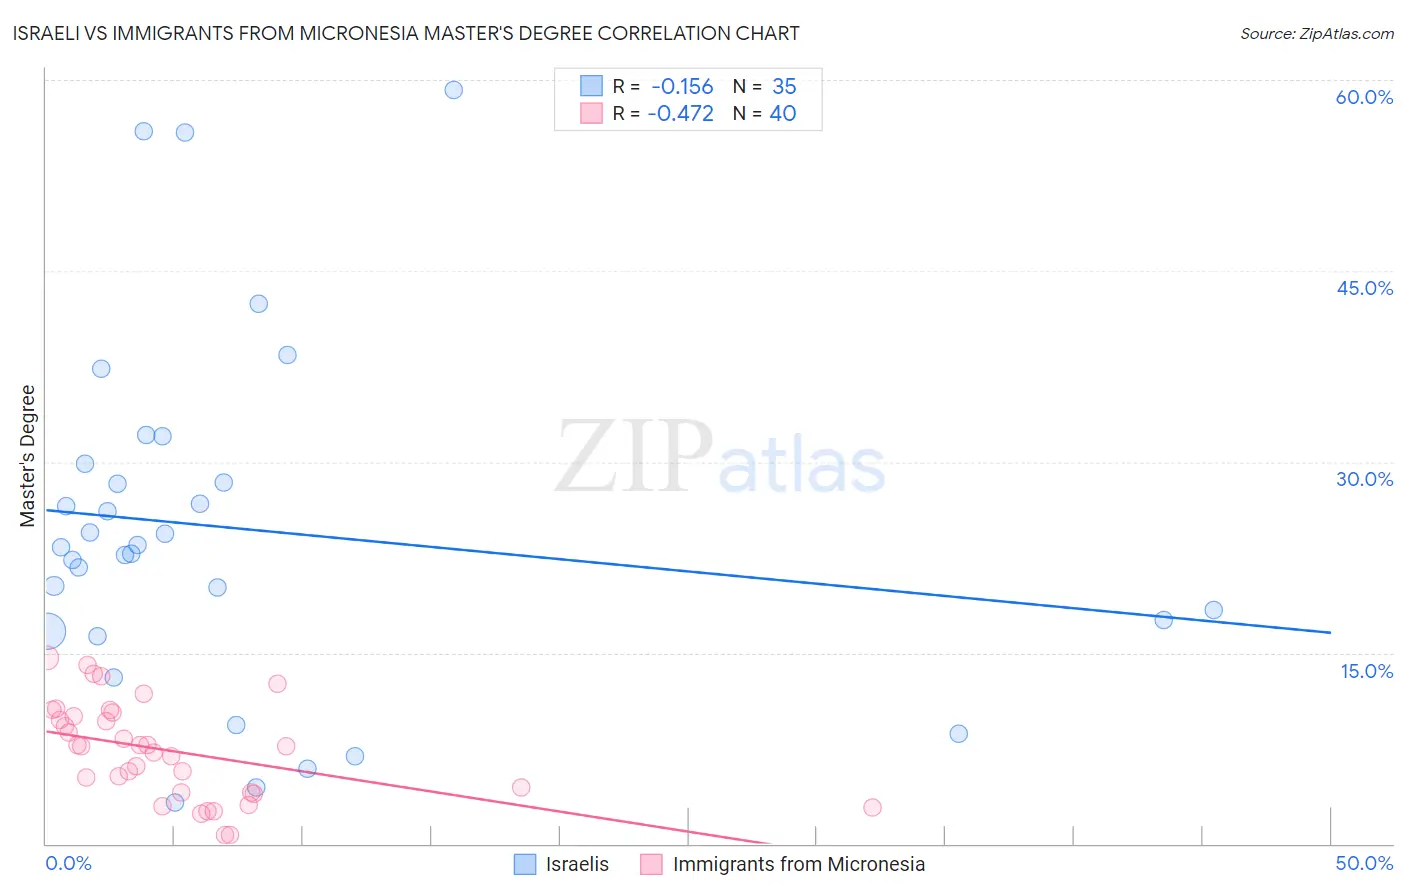
Israeli vs Immigrants from Micronesia Master's Degree Correlation Chart
The statistical analysis conducted on geographies consisting of 211,131,712 people shows a poor negative correlation between the proportion of Israelis and percentage of population with at least master's degree education in the United States with a correlation coefficient (R) of -0.156 and weighted average of 20.3%. Similarly, the statistical analysis conducted on geographies consisting of 61,602,639 people shows a moderate negative correlation between the proportion of Immigrants from Micronesia and percentage of population with at least master's degree education in the United States with a correlation coefficient (R) of -0.472 and weighted average of 10.8%, a difference of 89.0%.
Master's Degree Correlation Summary
| Measurement | Israeli | Immigrants from Micronesia |
| Minimum | 3.2% | 0.67% |
| Maximum | 59.3% | 14.6% |
| Range | 56.0% | 13.9% |
| Mean | 24.7% | 7.3% |
| Median | 23.3% | 7.7% |
| Interquartile 25% (IQ1) | 16.7% | 4.0% |
| Interquartile 75% (IQ3) | 29.9% | 10.2% |
| Interquartile Range (IQR) | 13.2% | 6.1% |
| Standard Deviation (Sample) | 13.8% | 3.8% |
| Standard Deviation (Population) | 13.6% | 3.7% |
Similar Demographics by Master's Degree
Demographics Similar to Israelis by Master's Degree
In terms of master's degree, the demographic groups most similar to Israelis are Immigrants from France (20.3%, a difference of 0.28%), Immigrants from Sweden (20.3%, a difference of 0.35%), Immigrants from Ireland (20.4%, a difference of 0.42%), Indian (Asian) (20.5%, a difference of 0.53%), and Immigrants from Hong Kong (20.5%, a difference of 0.55%).
| Demographics | Rating | Rank | Master's Degree |
| Immigrants | Eastern Asia | 100.0 /100 | #15 | Exceptional 20.8% |
| Immigrants | Belgium | 100.0 /100 | #16 | Exceptional 20.8% |
| Immigrants | South Central Asia | 100.0 /100 | #17 | Exceptional 20.7% |
| Soviet Union | 100.0 /100 | #18 | Exceptional 20.5% |
| Immigrants | Hong Kong | 100.0 /100 | #19 | Exceptional 20.5% |
| Indians (Asian) | 100.0 /100 | #20 | Exceptional 20.5% |
| Immigrants | Ireland | 100.0 /100 | #21 | Exceptional 20.4% |
| Israelis | 100.0 /100 | #22 | Exceptional 20.3% |
| Immigrants | France | 100.0 /100 | #23 | Exceptional 20.3% |
| Immigrants | Sweden | 100.0 /100 | #24 | Exceptional 20.3% |
| Immigrants | Japan | 100.0 /100 | #25 | Exceptional 20.0% |
| Cambodians | 100.0 /100 | #26 | Exceptional 20.0% |
| Immigrants | Sri Lanka | 100.0 /100 | #27 | Exceptional 19.9% |
| Turks | 100.0 /100 | #28 | Exceptional 19.9% |
| Latvians | 100.0 /100 | #29 | Exceptional 19.8% |
Demographics Similar to Immigrants from Micronesia by Master's Degree
In terms of master's degree, the demographic groups most similar to Immigrants from Micronesia are Pennsylvania German (10.7%, a difference of 0.21%), Kiowa (10.8%, a difference of 0.62%), Sioux (10.7%, a difference of 0.85%), Immigrants from Cuba (10.9%, a difference of 0.86%), and Hopi (10.9%, a difference of 0.99%).
| Demographics | Rating | Rank | Master's Degree |
| Yaqui | 0.0 /100 | #313 | Tragic 11.0% |
| Cajuns | 0.0 /100 | #314 | Tragic 11.0% |
| Apache | 0.0 /100 | #315 | Tragic 11.0% |
| Hispanics or Latinos | 0.0 /100 | #316 | Tragic 10.9% |
| Hopi | 0.0 /100 | #317 | Tragic 10.9% |
| Immigrants | Cuba | 0.0 /100 | #318 | Tragic 10.9% |
| Kiowa | 0.0 /100 | #319 | Tragic 10.8% |
| Immigrants | Micronesia | 0.0 /100 | #320 | Tragic 10.8% |
| Pennsylvania Germans | 0.0 /100 | #321 | Tragic 10.7% |
| Sioux | 0.0 /100 | #322 | Tragic 10.7% |
| Crow | 0.0 /100 | #323 | Tragic 10.6% |
| Dutch West Indians | 0.0 /100 | #324 | Tragic 10.6% |
| Inupiat | 0.0 /100 | #325 | Tragic 10.5% |
| Creek | 0.0 /100 | #326 | Tragic 10.5% |
| Paiute | 0.0 /100 | #327 | Tragic 10.5% |