Subsaharan African vs Immigrants from Poland Doctorate Degree
COMPARE
Subsaharan African
Immigrants from Poland
Doctorate Degree
Doctorate Degree Comparison
Sub-Saharan Africans
Immigrants from Poland
1.8%
DOCTORATE DEGREE
25.1/ 100
METRIC RATING
196th/ 347
METRIC RANK
1.7%
DOCTORATE DEGREE
7.4/ 100
METRIC RATING
224th/ 347
METRIC RANK
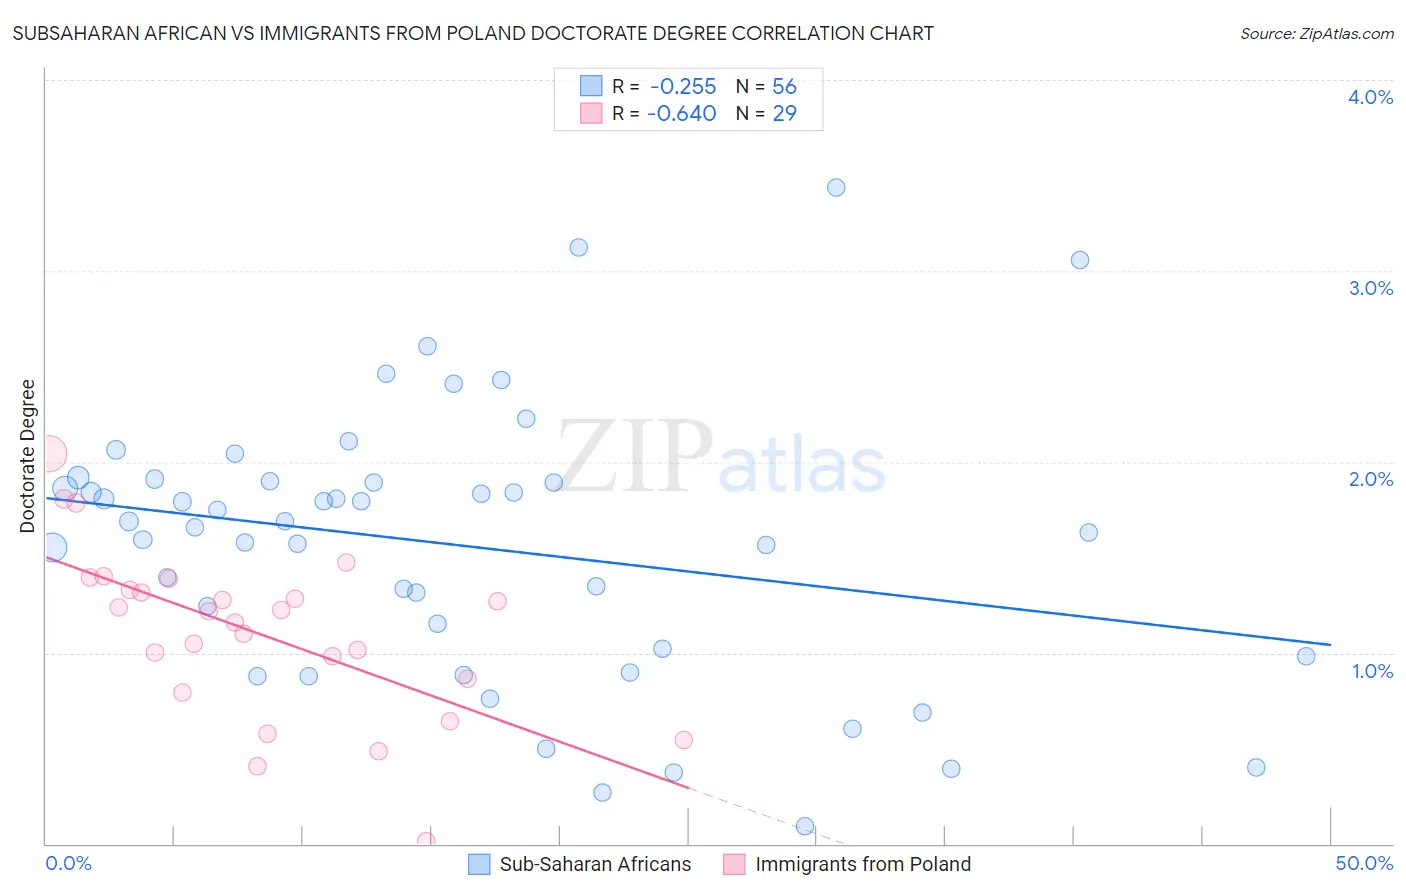
Subsaharan African vs Immigrants from Poland Doctorate Degree Correlation Chart
The statistical analysis conducted on geographies consisting of 497,272,855 people shows a weak negative correlation between the proportion of Sub-Saharan Africans and percentage of population with at least doctorate degree education in the United States with a correlation coefficient (R) of -0.255 and weighted average of 1.8%. Similarly, the statistical analysis conducted on geographies consisting of 303,139,955 people shows a significant negative correlation between the proportion of Immigrants from Poland and percentage of population with at least doctorate degree education in the United States with a correlation coefficient (R) of -0.640 and weighted average of 1.7%, a difference of 5.8%.
Doctorate Degree Correlation Summary
| Measurement | Subsaharan African | Immigrants from Poland |
| Minimum | 0.094% | 0.013% |
| Maximum | 3.4% | 2.0% |
| Range | 3.3% | 2.0% |
| Mean | 1.6% | 1.1% |
| Median | 1.7% | 1.2% |
| Interquartile 25% (IQ1) | 1.0% | 0.83% |
| Interquartile 75% (IQ3) | 1.9% | 1.4% |
| Interquartile Range (IQR) | 0.89% | 0.53% |
| Standard Deviation (Sample) | 0.72% | 0.44% |
| Standard Deviation (Population) | 0.71% | 0.44% |
Similar Demographics by Doctorate Degree
Demographics Similar to Sub-Saharan Africans by Doctorate Degree
In terms of doctorate degree, the demographic groups most similar to Sub-Saharan Africans are Chinese (1.8%, a difference of 0.0%), Immigrants from Somalia (1.8%, a difference of 0.070%), Immigrants from Ghana (1.8%, a difference of 0.090%), Uruguayan (1.8%, a difference of 0.22%), and Immigrants from South America (1.8%, a difference of 0.38%).
| Demographics | Rating | Rank | Doctorate Degree |
| French Canadians | 30.2 /100 | #189 | Fair 1.8% |
| Immigrants | Costa Rica | 30.2 /100 | #190 | Fair 1.8% |
| South Americans | 29.5 /100 | #191 | Fair 1.8% |
| Dutch | 27.4 /100 | #192 | Fair 1.8% |
| German Russians | 27.1 /100 | #193 | Fair 1.8% |
| Uruguayans | 26.2 /100 | #194 | Fair 1.8% |
| Immigrants | Somalia | 25.4 /100 | #195 | Fair 1.8% |
| Sub-Saharan Africans | 25.1 /100 | #196 | Fair 1.8% |
| Chinese | 25.1 /100 | #197 | Fair 1.8% |
| Immigrants | Ghana | 24.6 /100 | #198 | Fair 1.8% |
| Immigrants | South America | 23.3 /100 | #199 | Fair 1.8% |
| Whites/Caucasians | 22.8 /100 | #200 | Fair 1.8% |
| Immigrants | Nigeria | 22.4 /100 | #201 | Fair 1.8% |
| Portuguese | 21.4 /100 | #202 | Fair 1.8% |
| Immigrants | Vietnam | 21.4 /100 | #203 | Fair 1.8% |
Demographics Similar to Immigrants from Poland by Doctorate Degree
In terms of doctorate degree, the demographic groups most similar to Immigrants from Poland are Immigrants from Bosnia and Herzegovina (1.7%, a difference of 0.22%), Immigrants from Colombia (1.7%, a difference of 0.49%), Osage (1.7%, a difference of 0.61%), Immigrants from Venezuela (1.7%, a difference of 0.68%), and Nonimmigrants (1.7%, a difference of 0.75%).
| Demographics | Rating | Rank | Doctorate Degree |
| Spanish Americans | 12.9 /100 | #217 | Poor 1.7% |
| Tlingit-Haida | 11.9 /100 | #218 | Poor 1.7% |
| Immigrants | Iraq | 10.7 /100 | #219 | Poor 1.7% |
| Immigrants | Uruguay | 9.2 /100 | #220 | Tragic 1.7% |
| Immigrants | Nonimmigrants | 8.8 /100 | #221 | Tragic 1.7% |
| Immigrants | Venezuela | 8.7 /100 | #222 | Tragic 1.7% |
| Immigrants | Bosnia and Herzegovina | 7.8 /100 | #223 | Tragic 1.7% |
| Immigrants | Poland | 7.4 /100 | #224 | Tragic 1.7% |
| Immigrants | Colombia | 6.7 /100 | #225 | Tragic 1.7% |
| Osage | 6.5 /100 | #226 | Tragic 1.7% |
| Panamanians | 6.3 /100 | #227 | Tragic 1.7% |
| Assyrians/Chaldeans/Syriacs | 5.9 /100 | #228 | Tragic 1.7% |
| Colville | 4.7 /100 | #229 | Tragic 1.6% |
| Immigrants | Philippines | 4.3 /100 | #230 | Tragic 1.6% |
| Immigrants | North Macedonia | 3.9 /100 | #231 | Tragic 1.6% |