Immigrants from Denmark vs Immigrants from Poland Doctorate Degree
COMPARE
Immigrants from Denmark
Immigrants from Poland
Doctorate Degree
Doctorate Degree Comparison
Immigrants from Denmark
Immigrants from Poland
2.8%
DOCTORATE DEGREE
100.0/ 100
METRIC RATING
23rd/ 347
METRIC RANK
1.7%
DOCTORATE DEGREE
7.4/ 100
METRIC RATING
224th/ 347
METRIC RANK
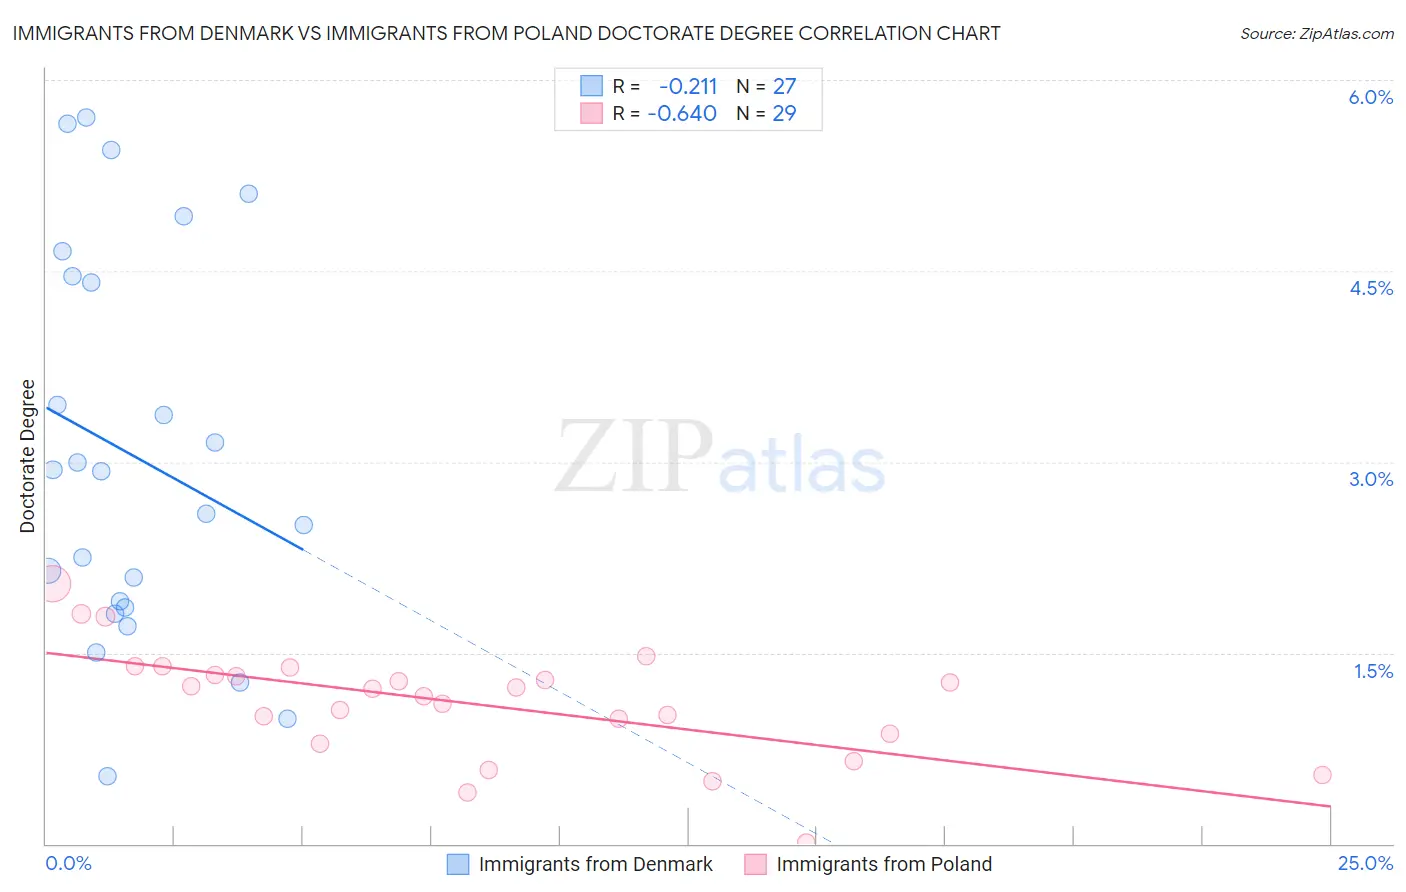
Immigrants from Denmark vs Immigrants from Poland Doctorate Degree Correlation Chart
The statistical analysis conducted on geographies consisting of 136,129,405 people shows a weak negative correlation between the proportion of Immigrants from Denmark and percentage of population with at least doctorate degree education in the United States with a correlation coefficient (R) of -0.211 and weighted average of 2.8%. Similarly, the statistical analysis conducted on geographies consisting of 303,139,955 people shows a significant negative correlation between the proportion of Immigrants from Poland and percentage of population with at least doctorate degree education in the United States with a correlation coefficient (R) of -0.640 and weighted average of 1.7%, a difference of 65.1%.
Doctorate Degree Correlation Summary
| Measurement | Immigrants from Denmark | Immigrants from Poland |
| Minimum | 0.53% | 0.013% |
| Maximum | 5.7% | 2.0% |
| Range | 5.2% | 2.0% |
| Mean | 3.1% | 1.1% |
| Median | 2.9% | 1.2% |
| Interquartile 25% (IQ1) | 1.9% | 0.83% |
| Interquartile 75% (IQ3) | 4.5% | 1.4% |
| Interquartile Range (IQR) | 2.6% | 0.53% |
| Standard Deviation (Sample) | 1.5% | 0.44% |
| Standard Deviation (Population) | 1.5% | 0.44% |
Similar Demographics by Doctorate Degree
Demographics Similar to Immigrants from Denmark by Doctorate Degree
In terms of doctorate degree, the demographic groups most similar to Immigrants from Denmark are Mongolian (2.8%, a difference of 0.13%), Thai (2.8%, a difference of 0.33%), Immigrants from Hong Kong (2.8%, a difference of 0.68%), Immigrants from Japan (2.8%, a difference of 1.0%), and Israeli (2.7%, a difference of 1.3%).
| Demographics | Rating | Rank | Doctorate Degree |
| Eastern Europeans | 100.0 /100 | #16 | Exceptional 2.8% |
| Immigrants | Australia | 100.0 /100 | #17 | Exceptional 2.8% |
| Immigrants | Sri Lanka | 100.0 /100 | #18 | Exceptional 2.8% |
| Immigrants | Japan | 100.0 /100 | #19 | Exceptional 2.8% |
| Immigrants | Hong Kong | 100.0 /100 | #20 | Exceptional 2.8% |
| Thais | 100.0 /100 | #21 | Exceptional 2.8% |
| Mongolians | 100.0 /100 | #22 | Exceptional 2.8% |
| Immigrants | Denmark | 100.0 /100 | #23 | Exceptional 2.8% |
| Israelis | 100.0 /100 | #24 | Exceptional 2.7% |
| Immigrants | Saudi Arabia | 100.0 /100 | #25 | Exceptional 2.7% |
| Turks | 100.0 /100 | #26 | Exceptional 2.7% |
| Immigrants | Turkey | 100.0 /100 | #27 | Exceptional 2.6% |
| Burmese | 100.0 /100 | #28 | Exceptional 2.6% |
| Immigrants | South Central Asia | 100.0 /100 | #29 | Exceptional 2.6% |
| Immigrants | Korea | 100.0 /100 | #30 | Exceptional 2.6% |
Demographics Similar to Immigrants from Poland by Doctorate Degree
In terms of doctorate degree, the demographic groups most similar to Immigrants from Poland are Immigrants from Bosnia and Herzegovina (1.7%, a difference of 0.22%), Immigrants from Colombia (1.7%, a difference of 0.49%), Osage (1.7%, a difference of 0.61%), Immigrants from Venezuela (1.7%, a difference of 0.68%), and Nonimmigrants (1.7%, a difference of 0.75%).
| Demographics | Rating | Rank | Doctorate Degree |
| Spanish Americans | 12.9 /100 | #217 | Poor 1.7% |
| Tlingit-Haida | 11.9 /100 | #218 | Poor 1.7% |
| Immigrants | Iraq | 10.7 /100 | #219 | Poor 1.7% |
| Immigrants | Uruguay | 9.2 /100 | #220 | Tragic 1.7% |
| Immigrants | Nonimmigrants | 8.8 /100 | #221 | Tragic 1.7% |
| Immigrants | Venezuela | 8.7 /100 | #222 | Tragic 1.7% |
| Immigrants | Bosnia and Herzegovina | 7.8 /100 | #223 | Tragic 1.7% |
| Immigrants | Poland | 7.4 /100 | #224 | Tragic 1.7% |
| Immigrants | Colombia | 6.7 /100 | #225 | Tragic 1.7% |
| Osage | 6.5 /100 | #226 | Tragic 1.7% |
| Panamanians | 6.3 /100 | #227 | Tragic 1.7% |
| Assyrians/Chaldeans/Syriacs | 5.9 /100 | #228 | Tragic 1.7% |
| Colville | 4.7 /100 | #229 | Tragic 1.6% |
| Immigrants | Philippines | 4.3 /100 | #230 | Tragic 1.6% |
| Immigrants | North Macedonia | 3.9 /100 | #231 | Tragic 1.6% |