South African vs Immigrants from Poland Doctorate Degree
COMPARE
South African
Immigrants from Poland
Doctorate Degree
Doctorate Degree Comparison
South Africans
Immigrants from Poland
2.3%
DOCTORATE DEGREE
99.9/ 100
METRIC RATING
59th/ 347
METRIC RANK
1.7%
DOCTORATE DEGREE
7.4/ 100
METRIC RATING
224th/ 347
METRIC RANK
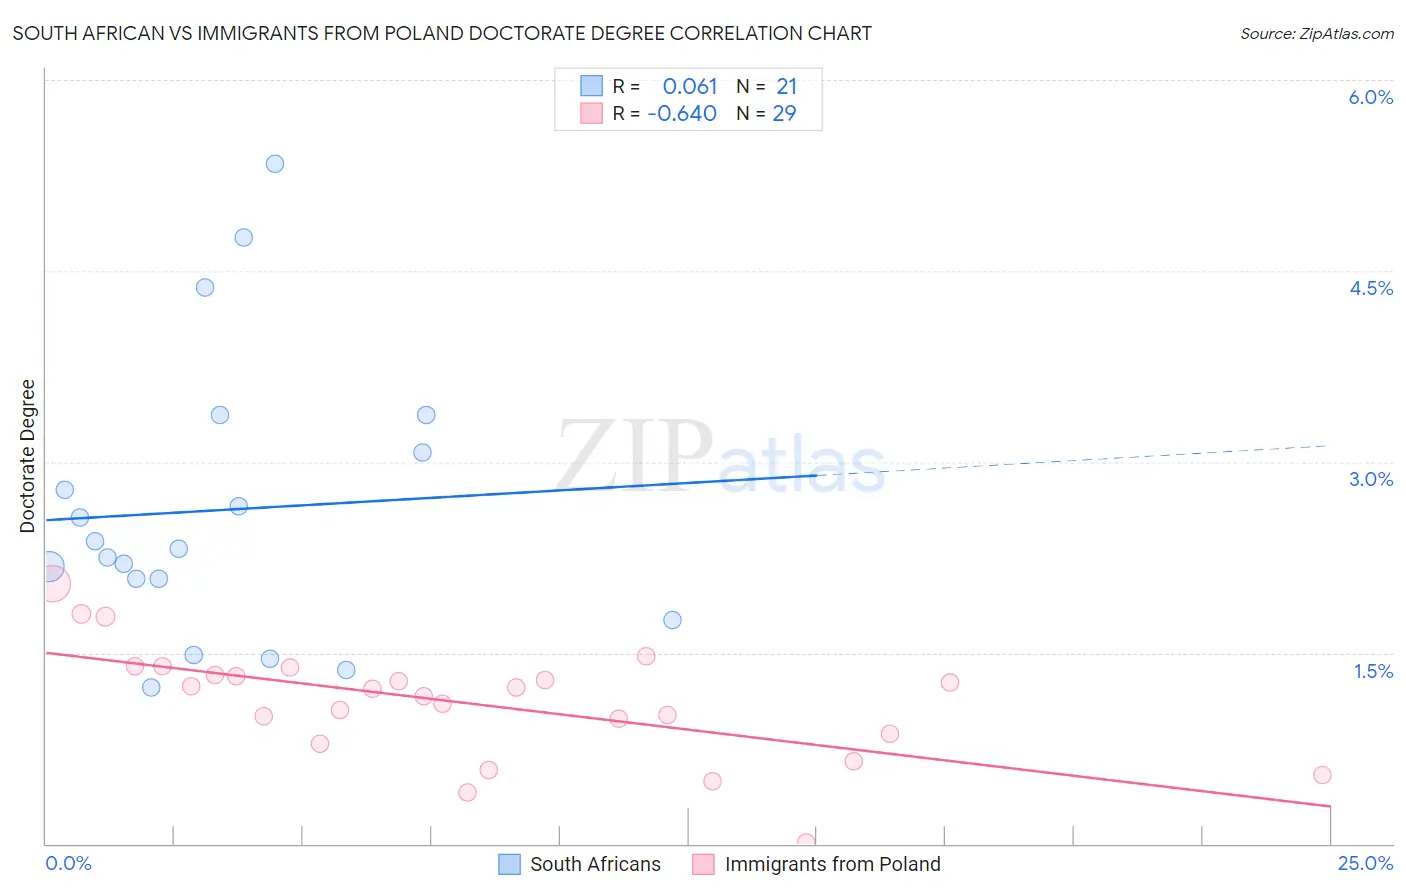
South African vs Immigrants from Poland Doctorate Degree Correlation Chart
The statistical analysis conducted on geographies consisting of 182,049,021 people shows a slight positive correlation between the proportion of South Africans and percentage of population with at least doctorate degree education in the United States with a correlation coefficient (R) of 0.061 and weighted average of 2.3%. Similarly, the statistical analysis conducted on geographies consisting of 303,139,955 people shows a significant negative correlation between the proportion of Immigrants from Poland and percentage of population with at least doctorate degree education in the United States with a correlation coefficient (R) of -0.640 and weighted average of 1.7%, a difference of 40.2%.
Doctorate Degree Correlation Summary
| Measurement | South African | Immigrants from Poland |
| Minimum | 1.2% | 0.013% |
| Maximum | 5.3% | 2.0% |
| Range | 4.1% | 2.0% |
| Mean | 2.6% | 1.1% |
| Median | 2.3% | 1.2% |
| Interquartile 25% (IQ1) | 1.9% | 0.83% |
| Interquartile 75% (IQ3) | 3.2% | 1.4% |
| Interquartile Range (IQR) | 1.3% | 0.53% |
| Standard Deviation (Sample) | 1.1% | 0.44% |
| Standard Deviation (Population) | 1.1% | 0.44% |
Similar Demographics by Doctorate Degree
Demographics Similar to South Africans by Doctorate Degree
In terms of doctorate degree, the demographic groups most similar to South Africans are Immigrants from Serbia (2.3%, a difference of 0.020%), Ethiopian (2.3%, a difference of 0.44%), Immigrants from Ethiopia (2.4%, a difference of 0.56%), Bhutanese (2.3%, a difference of 0.79%), and Immigrants from Czechoslovakia (2.4%, a difference of 1.0%).
| Demographics | Rating | Rank | Doctorate Degree |
| Bulgarians | 100.0 /100 | #52 | Exceptional 2.4% |
| Immigrants | Latvia | 100.0 /100 | #53 | Exceptional 2.4% |
| Immigrants | Indonesia | 100.0 /100 | #54 | Exceptional 2.4% |
| Bolivians | 100.0 /100 | #55 | Exceptional 2.4% |
| Immigrants | Czechoslovakia | 100.0 /100 | #56 | Exceptional 2.4% |
| Immigrants | Ethiopia | 100.0 /100 | #57 | Exceptional 2.4% |
| Ethiopians | 99.9 /100 | #58 | Exceptional 2.3% |
| South Africans | 99.9 /100 | #59 | Exceptional 2.3% |
| Immigrants | Serbia | 99.9 /100 | #60 | Exceptional 2.3% |
| Bhutanese | 99.9 /100 | #61 | Exceptional 2.3% |
| Immigrants | Europe | 99.9 /100 | #62 | Exceptional 2.3% |
| Laotians | 99.9 /100 | #63 | Exceptional 2.3% |
| Immigrants | Greece | 99.9 /100 | #64 | Exceptional 2.3% |
| Paraguayans | 99.9 /100 | #65 | Exceptional 2.3% |
| Argentineans | 99.9 /100 | #66 | Exceptional 2.3% |
Demographics Similar to Immigrants from Poland by Doctorate Degree
In terms of doctorate degree, the demographic groups most similar to Immigrants from Poland are Immigrants from Bosnia and Herzegovina (1.7%, a difference of 0.22%), Immigrants from Colombia (1.7%, a difference of 0.49%), Osage (1.7%, a difference of 0.61%), Immigrants from Venezuela (1.7%, a difference of 0.68%), and Nonimmigrants (1.7%, a difference of 0.75%).
| Demographics | Rating | Rank | Doctorate Degree |
| Spanish Americans | 12.9 /100 | #217 | Poor 1.7% |
| Tlingit-Haida | 11.9 /100 | #218 | Poor 1.7% |
| Immigrants | Iraq | 10.7 /100 | #219 | Poor 1.7% |
| Immigrants | Uruguay | 9.2 /100 | #220 | Tragic 1.7% |
| Immigrants | Nonimmigrants | 8.8 /100 | #221 | Tragic 1.7% |
| Immigrants | Venezuela | 8.7 /100 | #222 | Tragic 1.7% |
| Immigrants | Bosnia and Herzegovina | 7.8 /100 | #223 | Tragic 1.7% |
| Immigrants | Poland | 7.4 /100 | #224 | Tragic 1.7% |
| Immigrants | Colombia | 6.7 /100 | #225 | Tragic 1.7% |
| Osage | 6.5 /100 | #226 | Tragic 1.7% |
| Panamanians | 6.3 /100 | #227 | Tragic 1.7% |
| Assyrians/Chaldeans/Syriacs | 5.9 /100 | #228 | Tragic 1.7% |
| Colville | 4.7 /100 | #229 | Tragic 1.6% |
| Immigrants | Philippines | 4.3 /100 | #230 | Tragic 1.6% |
| Immigrants | North Macedonia | 3.9 /100 | #231 | Tragic 1.6% |