Irish vs Immigrants from Argentina Doctorate Degree
COMPARE
Irish
Immigrants from Argentina
Doctorate Degree
Doctorate Degree Comparison
Irish
Immigrants from Argentina
1.9%
DOCTORATE DEGREE
67.5/ 100
METRIC RATING
162nd/ 347
METRIC RANK
2.2%
DOCTORATE DEGREE
99.7/ 100
METRIC RATING
81st/ 347
METRIC RANK
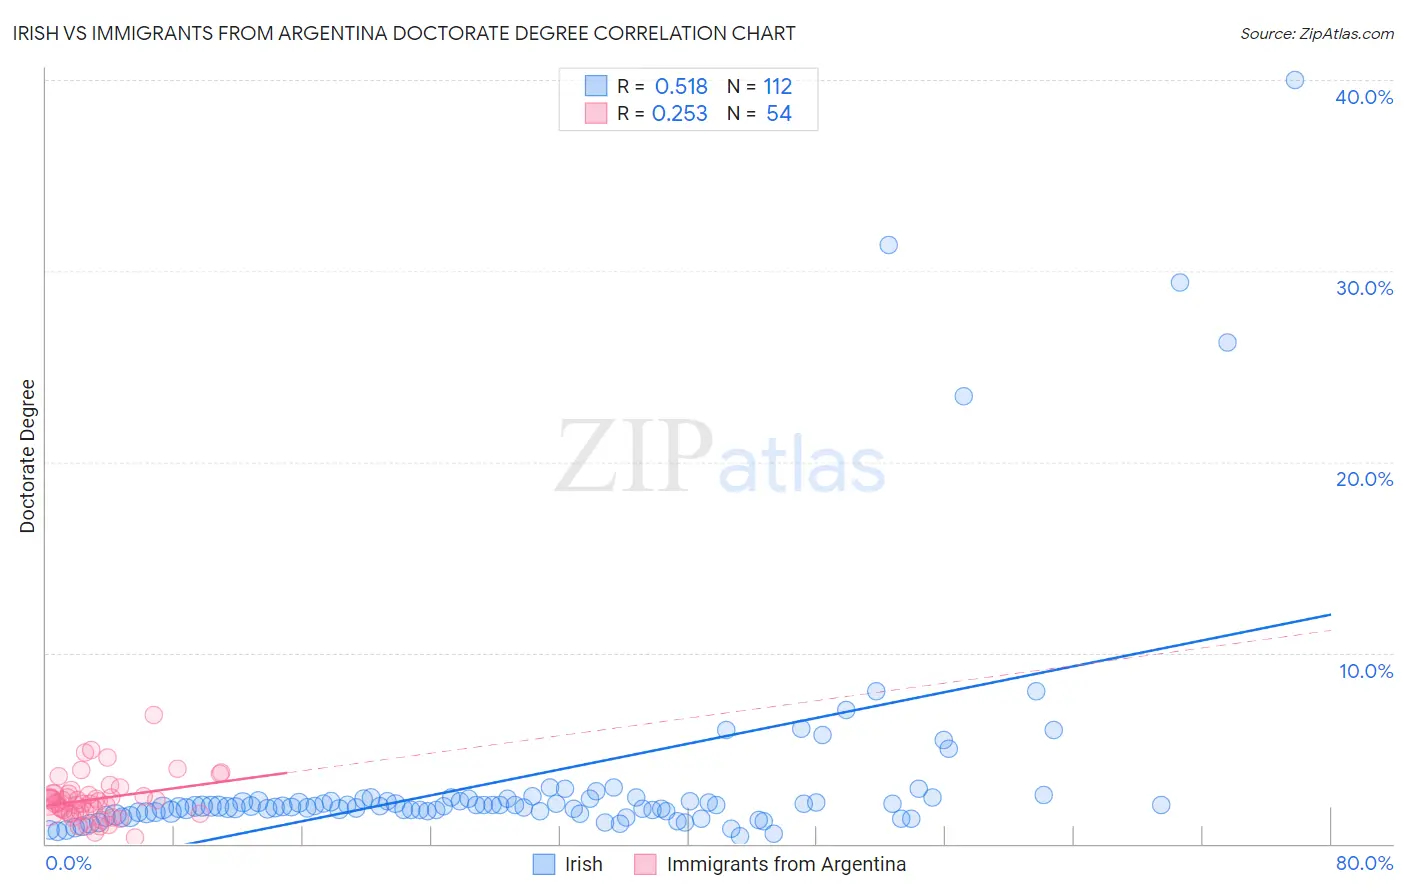
Irish vs Immigrants from Argentina Doctorate Degree Correlation Chart
The statistical analysis conducted on geographies consisting of 550,861,641 people shows a substantial positive correlation between the proportion of Irish and percentage of population with at least doctorate degree education in the United States with a correlation coefficient (R) of 0.518 and weighted average of 1.9%. Similarly, the statistical analysis conducted on geographies consisting of 263,715,888 people shows a weak positive correlation between the proportion of Immigrants from Argentina and percentage of population with at least doctorate degree education in the United States with a correlation coefficient (R) of 0.253 and weighted average of 2.2%, a difference of 17.8%.
Doctorate Degree Correlation Summary
| Measurement | Irish | Immigrants from Argentina |
| Minimum | 0.38% | 0.32% |
| Maximum | 40.0% | 6.7% |
| Range | 39.6% | 6.4% |
| Mean | 3.4% | 2.3% |
| Median | 2.0% | 2.2% |
| Interquartile 25% (IQ1) | 1.7% | 1.7% |
| Interquartile 75% (IQ3) | 2.3% | 2.6% |
| Interquartile Range (IQR) | 0.66% | 0.95% |
| Standard Deviation (Sample) | 6.1% | 1.2% |
| Standard Deviation (Population) | 6.0% | 1.2% |
Similar Demographics by Doctorate Degree
Demographics Similar to Irish by Doctorate Degree
In terms of doctorate degree, the demographic groups most similar to Irish are Czech (1.9%, a difference of 0.040%), Celtic (1.9%, a difference of 0.13%), Immigrants from Middle Africa (1.9%, a difference of 0.21%), Welsh (1.9%, a difference of 0.36%), and Slovene (1.9%, a difference of 0.45%).
| Demographics | Rating | Rank | Doctorate Degree |
| Poles | 72.7 /100 | #155 | Good 1.9% |
| Slavs | 72.4 /100 | #156 | Good 1.9% |
| Danes | 71.9 /100 | #157 | Good 1.9% |
| Hungarians | 71.7 /100 | #158 | Good 1.9% |
| Slovenes | 70.2 /100 | #159 | Good 1.9% |
| Welsh | 69.7 /100 | #160 | Good 1.9% |
| Immigrants | Middle Africa | 68.8 /100 | #161 | Good 1.9% |
| Irish | 67.5 /100 | #162 | Good 1.9% |
| Czechs | 67.3 /100 | #163 | Good 1.9% |
| Celtics | 66.7 /100 | #164 | Good 1.9% |
| Scotch-Irish | 63.6 /100 | #165 | Good 1.9% |
| Spaniards | 63.5 /100 | #166 | Good 1.9% |
| Macedonians | 60.9 /100 | #167 | Good 1.9% |
| Sri Lankans | 60.3 /100 | #168 | Good 1.9% |
| Vietnamese | 54.8 /100 | #169 | Average 1.9% |
Demographics Similar to Immigrants from Argentina by Doctorate Degree
In terms of doctorate degree, the demographic groups most similar to Immigrants from Argentina are Ugandan (2.2%, a difference of 0.050%), Northern European (2.2%, a difference of 0.34%), Immigrants from Belarus (2.2%, a difference of 0.40%), Immigrants from Uganda (2.2%, a difference of 0.54%), and Immigrants from Lithuania (2.2%, a difference of 0.71%).
| Demographics | Rating | Rank | Doctorate Degree |
| Immigrants | North America | 99.8 /100 | #74 | Exceptional 2.2% |
| Immigrants | Western Asia | 99.8 /100 | #75 | Exceptional 2.2% |
| Immigrants | Hungary | 99.8 /100 | #76 | Exceptional 2.2% |
| Immigrants | Lebanon | 99.8 /100 | #77 | Exceptional 2.2% |
| Immigrants | Belarus | 99.7 /100 | #78 | Exceptional 2.2% |
| Northern Europeans | 99.7 /100 | #79 | Exceptional 2.2% |
| Ugandans | 99.7 /100 | #80 | Exceptional 2.2% |
| Immigrants | Argentina | 99.7 /100 | #81 | Exceptional 2.2% |
| Immigrants | Uganda | 99.6 /100 | #82 | Exceptional 2.2% |
| Immigrants | Lithuania | 99.6 /100 | #83 | Exceptional 2.2% |
| Immigrants | England | 99.6 /100 | #84 | Exceptional 2.2% |
| Immigrants | Brazil | 99.6 /100 | #85 | Exceptional 2.2% |
| Egyptians | 99.4 /100 | #86 | Exceptional 2.2% |
| Immigrants | Zimbabwe | 99.4 /100 | #87 | Exceptional 2.2% |
| Immigrants | Nepal | 99.3 /100 | #88 | Exceptional 2.2% |