Yugoslavian vs Immigrants from Poland Doctorate Degree
COMPARE
Yugoslavian
Immigrants from Poland
Doctorate Degree
Doctorate Degree Comparison
Yugoslavians
Immigrants from Poland
1.7%
DOCTORATE DEGREE
17.1/ 100
METRIC RATING
207th/ 347
METRIC RANK
1.7%
DOCTORATE DEGREE
7.4/ 100
METRIC RATING
224th/ 347
METRIC RANK
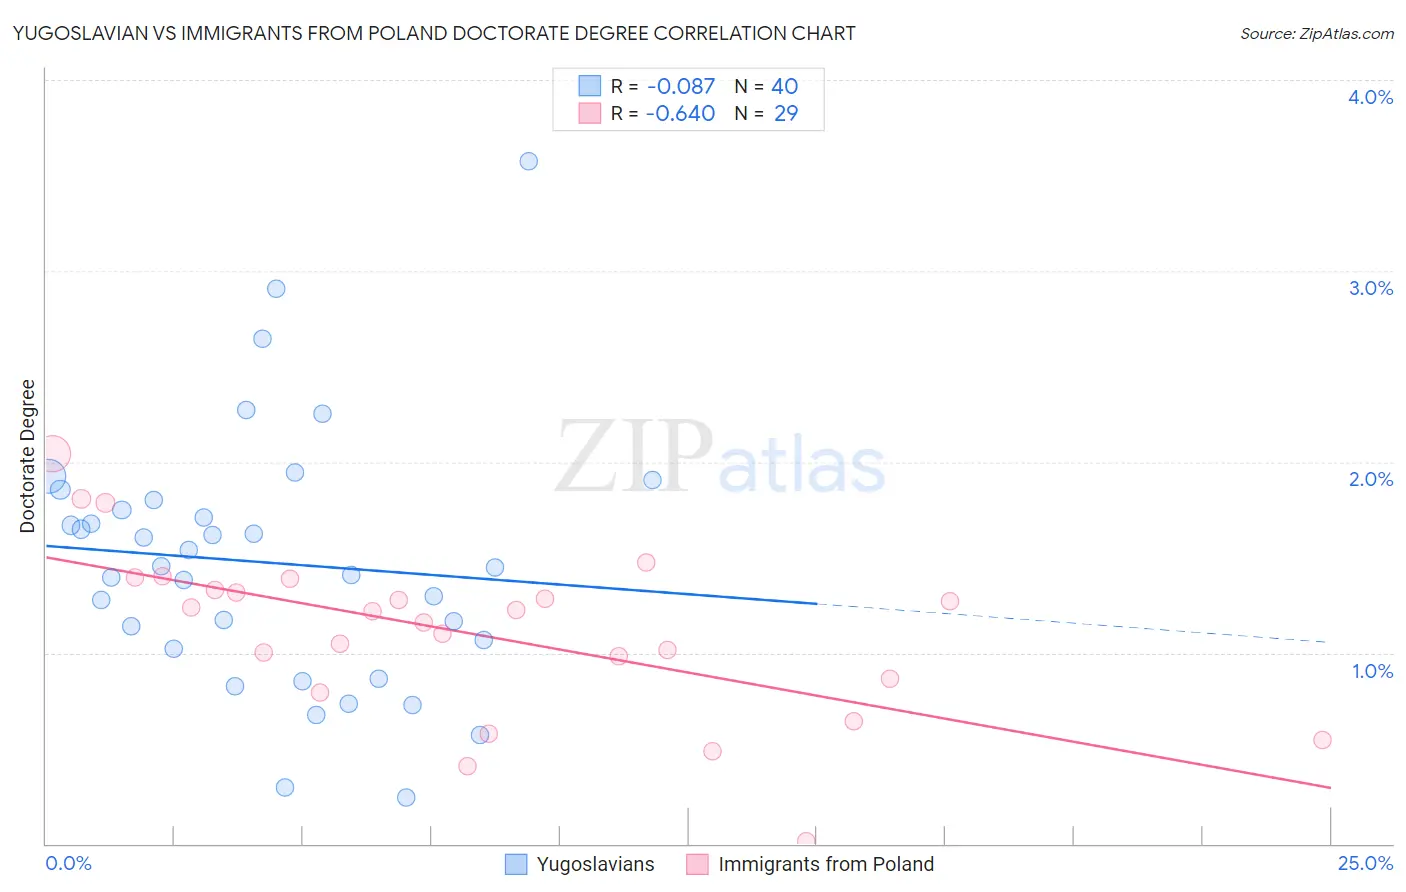
Yugoslavian vs Immigrants from Poland Doctorate Degree Correlation Chart
The statistical analysis conducted on geographies consisting of 283,502,598 people shows a slight negative correlation between the proportion of Yugoslavians and percentage of population with at least doctorate degree education in the United States with a correlation coefficient (R) of -0.087 and weighted average of 1.7%. Similarly, the statistical analysis conducted on geographies consisting of 303,139,955 people shows a significant negative correlation between the proportion of Immigrants from Poland and percentage of population with at least doctorate degree education in the United States with a correlation coefficient (R) of -0.640 and weighted average of 1.7%, a difference of 3.8%.
Doctorate Degree Correlation Summary
| Measurement | Yugoslavian | Immigrants from Poland |
| Minimum | 0.24% | 0.013% |
| Maximum | 3.6% | 2.0% |
| Range | 3.3% | 2.0% |
| Mean | 1.5% | 1.1% |
| Median | 1.4% | 1.2% |
| Interquartile 25% (IQ1) | 1.0% | 0.83% |
| Interquartile 75% (IQ3) | 1.8% | 1.4% |
| Interquartile Range (IQR) | 0.73% | 0.53% |
| Standard Deviation (Sample) | 0.67% | 0.44% |
| Standard Deviation (Population) | 0.66% | 0.44% |
Demographics Similar to Yugoslavians and Immigrants from Poland by Doctorate Degree
In terms of doctorate degree, the demographic groups most similar to Yugoslavians are Immigrants from Peru (1.7%, a difference of 0.16%), Colombian (1.7%, a difference of 0.28%), Immigrants from Western Africa (1.7%, a difference of 0.47%), Tongan (1.7%, a difference of 0.56%), and Immigrants from Armenia (1.7%, a difference of 0.57%). Similarly, the demographic groups most similar to Immigrants from Poland are Immigrants from Bosnia and Herzegovina (1.7%, a difference of 0.22%), Immigrants from Colombia (1.7%, a difference of 0.49%), Immigrants from Venezuela (1.7%, a difference of 0.68%), Nonimmigrants (1.7%, a difference of 0.75%), and Immigrants from Uruguay (1.7%, a difference of 0.94%).
| Demographics | Rating | Rank | Doctorate Degree |
| Venezuelans | 19.5 /100 | #205 | Poor 1.7% |
| Immigrants | Peru | 17.6 /100 | #206 | Poor 1.7% |
| Yugoslavians | 17.1 /100 | #207 | Poor 1.7% |
| Colombians | 16.1 /100 | #208 | Poor 1.7% |
| Immigrants | Western Africa | 15.4 /100 | #209 | Poor 1.7% |
| Tongans | 15.1 /100 | #210 | Poor 1.7% |
| Immigrants | Armenia | 15.1 /100 | #211 | Poor 1.7% |
| Immigrants | South Eastern Asia | 14.7 /100 | #212 | Poor 1.7% |
| Koreans | 14.2 /100 | #213 | Poor 1.7% |
| Pueblo | 14.2 /100 | #214 | Poor 1.7% |
| Alaskan Athabascans | 13.8 /100 | #215 | Poor 1.7% |
| Immigrants | Burma/Myanmar | 13.5 /100 | #216 | Poor 1.7% |
| Spanish Americans | 12.9 /100 | #217 | Poor 1.7% |
| Tlingit-Haida | 11.9 /100 | #218 | Poor 1.7% |
| Immigrants | Iraq | 10.7 /100 | #219 | Poor 1.7% |
| Immigrants | Uruguay | 9.2 /100 | #220 | Tragic 1.7% |
| Immigrants | Nonimmigrants | 8.8 /100 | #221 | Tragic 1.7% |
| Immigrants | Venezuela | 8.7 /100 | #222 | Tragic 1.7% |
| Immigrants | Bosnia and Herzegovina | 7.8 /100 | #223 | Tragic 1.7% |
| Immigrants | Poland | 7.4 /100 | #224 | Tragic 1.7% |
| Immigrants | Colombia | 6.7 /100 | #225 | Tragic 1.7% |