Irish vs British West Indian 11th Grade
COMPARE
Irish
British West Indian
11th Grade
11th Grade Comparison
Irish
British West Indians
94.4%
11TH GRADE
100.0/ 100
METRIC RATING
25th/ 347
METRIC RANK
90.3%
11TH GRADE
0.0/ 100
METRIC RATING
289th/ 347
METRIC RANK
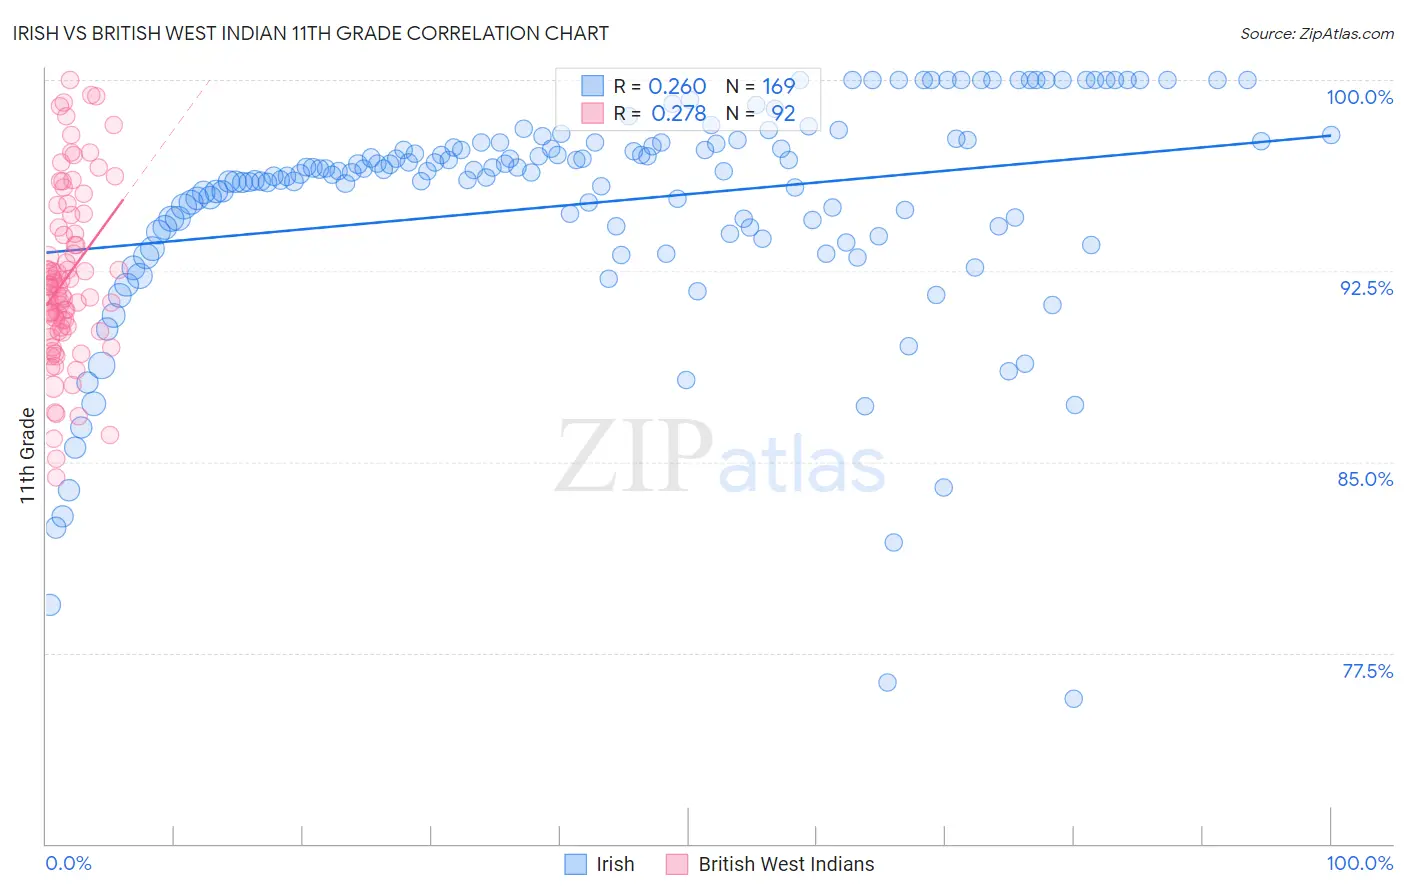
Irish vs British West Indian 11th Grade Correlation Chart
The statistical analysis conducted on geographies consisting of 580,710,164 people shows a weak positive correlation between the proportion of Irish and percentage of population with at least 11th grade education in the United States with a correlation coefficient (R) of 0.260 and weighted average of 94.4%. Similarly, the statistical analysis conducted on geographies consisting of 152,691,173 people shows a weak positive correlation between the proportion of British West Indians and percentage of population with at least 11th grade education in the United States with a correlation coefficient (R) of 0.278 and weighted average of 90.3%, a difference of 4.5%.
11th Grade Correlation Summary
| Measurement | Irish | British West Indian |
| Minimum | 75.7% | 84.4% |
| Maximum | 100.0% | 100.0% |
| Range | 24.3% | 15.6% |
| Mean | 95.2% | 92.3% |
| Median | 96.4% | 91.9% |
| Interquartile 25% (IQ1) | 94.1% | 90.2% |
| Interquartile 75% (IQ3) | 97.6% | 94.4% |
| Interquartile Range (IQR) | 3.4% | 4.2% |
| Standard Deviation (Sample) | 4.5% | 3.4% |
| Standard Deviation (Population) | 4.5% | 3.4% |
Similar Demographics by 11th Grade
Demographics Similar to Irish by 11th Grade
In terms of 11th grade, the demographic groups most similar to Irish are Scottish (94.4%, a difference of 0.0%), English (94.4%, a difference of 0.020%), European (94.4%, a difference of 0.020%), Estonian (94.4%, a difference of 0.030%), and Tsimshian (94.4%, a difference of 0.050%).
| Demographics | Rating | Rank | 11th Grade |
| Maltese | 100.0 /100 | #18 | Exceptional 94.5% |
| Scandinavians | 100.0 /100 | #19 | Exceptional 94.5% |
| Italians | 100.0 /100 | #20 | Exceptional 94.5% |
| Tlingit-Haida | 100.0 /100 | #21 | Exceptional 94.4% |
| Tsimshian | 100.0 /100 | #22 | Exceptional 94.4% |
| Czechs | 100.0 /100 | #23 | Exceptional 94.4% |
| English | 100.0 /100 | #24 | Exceptional 94.4% |
| Irish | 100.0 /100 | #25 | Exceptional 94.4% |
| Scottish | 100.0 /100 | #26 | Exceptional 94.4% |
| Europeans | 100.0 /100 | #27 | Exceptional 94.4% |
| Estonians | 100.0 /100 | #28 | Exceptional 94.4% |
| Dutch | 100.0 /100 | #29 | Exceptional 94.3% |
| Russians | 100.0 /100 | #30 | Exceptional 94.3% |
| Welsh | 99.9 /100 | #31 | Exceptional 94.2% |
| Belgians | 99.9 /100 | #32 | Exceptional 94.2% |
Demographics Similar to British West Indians by 11th Grade
In terms of 11th grade, the demographic groups most similar to British West Indians are Pennsylvania German (90.3%, a difference of 0.020%), Indonesian (90.3%, a difference of 0.020%), Immigrants from West Indies (90.4%, a difference of 0.050%), Apache (90.4%, a difference of 0.050%), and Haitian (90.3%, a difference of 0.060%).
| Demographics | Rating | Rank | 11th Grade |
| Immigrants | St. Vincent and the Grenadines | 0.0 /100 | #282 | Tragic 90.7% |
| Immigrants | Barbados | 0.0 /100 | #283 | Tragic 90.7% |
| Immigrants | Laos | 0.0 /100 | #284 | Tragic 90.5% |
| Immigrants | Burma/Myanmar | 0.0 /100 | #285 | Tragic 90.4% |
| Immigrants | West Indies | 0.0 /100 | #286 | Tragic 90.4% |
| Apache | 0.0 /100 | #287 | Tragic 90.4% |
| Pennsylvania Germans | 0.0 /100 | #288 | Tragic 90.3% |
| British West Indians | 0.0 /100 | #289 | Tragic 90.3% |
| Indonesians | 0.0 /100 | #290 | Tragic 90.3% |
| Haitians | 0.0 /100 | #291 | Tragic 90.3% |
| Cubans | 0.0 /100 | #292 | Tragic 90.2% |
| Natives/Alaskans | 0.0 /100 | #293 | Tragic 90.2% |
| Immigrants | Grenada | 0.0 /100 | #294 | Tragic 90.1% |
| Immigrants | Vietnam | 0.0 /100 | #295 | Tragic 90.0% |
| Fijians | 0.0 /100 | #296 | Tragic 90.0% |