Irish vs Filipino College, Under 1 year
COMPARE
Irish
Filipino
College, Under 1 year
College, Under 1 year Comparison
Irish
Filipinos
66.0%
COLLEGE, UNDER 1 YEAR
70.3/ 100
METRIC RATING
155th/ 347
METRIC RANK
75.5%
COLLEGE, UNDER 1 YEAR
100.0/ 100
METRIC RATING
1st/ 347
METRIC RANK
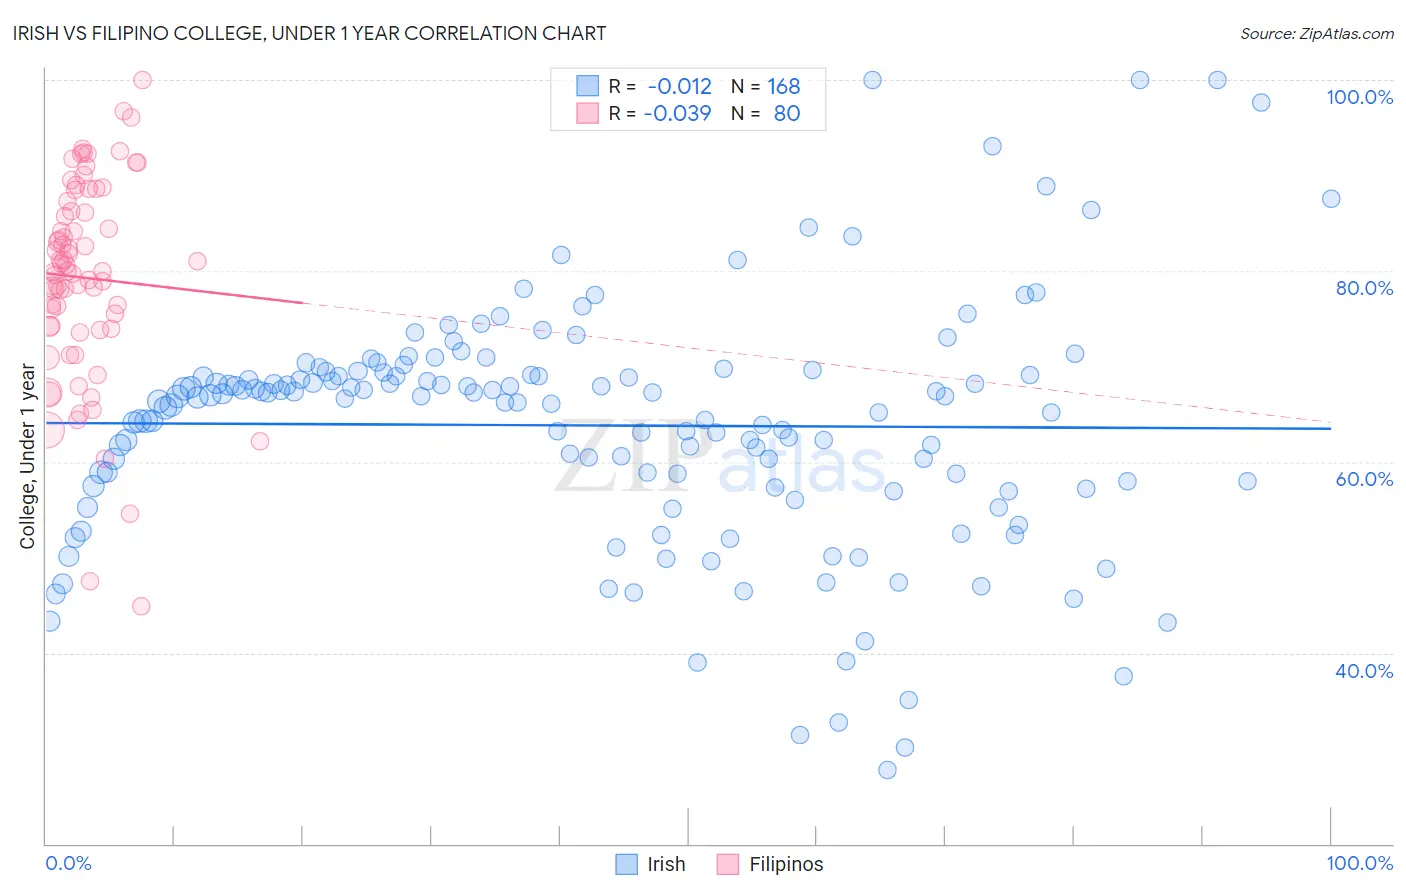
Irish vs Filipino College, Under 1 year Correlation Chart
The statistical analysis conducted on geographies consisting of 580,693,587 people shows no correlation between the proportion of Irish and percentage of population with at least college, under 1 year education in the United States with a correlation coefficient (R) of -0.012 and weighted average of 66.0%. Similarly, the statistical analysis conducted on geographies consisting of 254,347,651 people shows no correlation between the proportion of Filipinos and percentage of population with at least college, under 1 year education in the United States with a correlation coefficient (R) of -0.039 and weighted average of 75.5%, a difference of 14.3%.
College, Under 1 year Correlation Summary
| Measurement | Irish | Filipino |
| Minimum | 27.7% | 44.9% |
| Maximum | 100.0% | 100.0% |
| Range | 72.3% | 55.1% |
| Mean | 63.8% | 79.3% |
| Median | 66.7% | 80.0% |
| Interquartile 25% (IQ1) | 57.4% | 74.1% |
| Interquartile 75% (IQ3) | 69.1% | 86.8% |
| Interquartile Range (IQR) | 11.7% | 12.7% |
| Standard Deviation (Sample) | 12.6% | 10.6% |
| Standard Deviation (Population) | 12.6% | 10.6% |
Similar Demographics by College, Under 1 year
Demographics Similar to Irish by College, Under 1 year
In terms of college, under 1 year, the demographic groups most similar to Irish are Welsh (66.0%, a difference of 0.020%), Immigrants from Eritrea (66.1%, a difference of 0.090%), Sierra Leonean (66.0%, a difference of 0.12%), Celtic (65.9%, a difference of 0.15%), and Belgian (66.2%, a difference of 0.18%).
| Demographics | Rating | Rank | College, Under 1 year |
| Taiwanese | 78.6 /100 | #148 | Good 66.4% |
| Immigrants | Venezuela | 77.9 /100 | #149 | Good 66.3% |
| Immigrants | Iraq | 77.1 /100 | #150 | Good 66.3% |
| Immigrants | Sudan | 76.0 /100 | #151 | Good 66.2% |
| Sudanese | 74.1 /100 | #152 | Good 66.2% |
| Belgians | 73.7 /100 | #153 | Good 66.2% |
| Immigrants | Eritrea | 71.9 /100 | #154 | Good 66.1% |
| Irish | 70.3 /100 | #155 | Good 66.0% |
| Welsh | 69.9 /100 | #156 | Good 66.0% |
| Sierra Leoneans | 67.8 /100 | #157 | Good 66.0% |
| Celtics | 67.3 /100 | #158 | Good 65.9% |
| Tlingit-Haida | 66.4 /100 | #159 | Good 65.9% |
| Albanians | 66.1 /100 | #160 | Good 65.9% |
| Brazilians | 66.0 /100 | #161 | Good 65.9% |
| Koreans | 65.3 /100 | #162 | Good 65.9% |
Demographics Similar to Filipinos by College, Under 1 year
In terms of college, under 1 year, the demographic groups most similar to Filipinos are Iranian (74.9%, a difference of 0.85%), Immigrants from Singapore (74.8%, a difference of 0.90%), Immigrants from India (74.4%, a difference of 1.4%), Immigrants from Iran (74.3%, a difference of 1.7%), and Immigrants from Taiwan (74.2%, a difference of 1.8%).
| Demographics | Rating | Rank | College, Under 1 year |
| Filipinos | 100.0 /100 | #1 | Exceptional 75.5% |
| Iranians | 100.0 /100 | #2 | Exceptional 74.9% |
| Immigrants | Singapore | 100.0 /100 | #3 | Exceptional 74.8% |
| Immigrants | India | 100.0 /100 | #4 | Exceptional 74.4% |
| Immigrants | Iran | 100.0 /100 | #5 | Exceptional 74.3% |
| Immigrants | Taiwan | 100.0 /100 | #6 | Exceptional 74.2% |
| Okinawans | 100.0 /100 | #7 | Exceptional 73.7% |
| Thais | 100.0 /100 | #8 | Exceptional 73.4% |
| Immigrants | Australia | 100.0 /100 | #9 | Exceptional 72.7% |
| Immigrants | Israel | 100.0 /100 | #10 | Exceptional 72.3% |
| Immigrants | South Central Asia | 100.0 /100 | #11 | Exceptional 72.1% |
| Immigrants | Sweden | 100.0 /100 | #12 | Exceptional 72.1% |
| Cypriots | 100.0 /100 | #13 | Exceptional 72.0% |
| Cambodians | 100.0 /100 | #14 | Exceptional 71.9% |
| Burmese | 100.0 /100 | #15 | Exceptional 71.9% |