Iraqi vs Immigrants from Caribbean GED/Equivalency
COMPARE
Iraqi
Immigrants from Caribbean
GED/Equivalency
GED/Equivalency Comparison
Iraqis
Immigrants from Caribbean
86.2%
GED/EQUIVALENCY
75.2/ 100
METRIC RATING
155th/ 347
METRIC RANK
80.5%
GED/EQUIVALENCY
0.0/ 100
METRIC RATING
317th/ 347
METRIC RANK
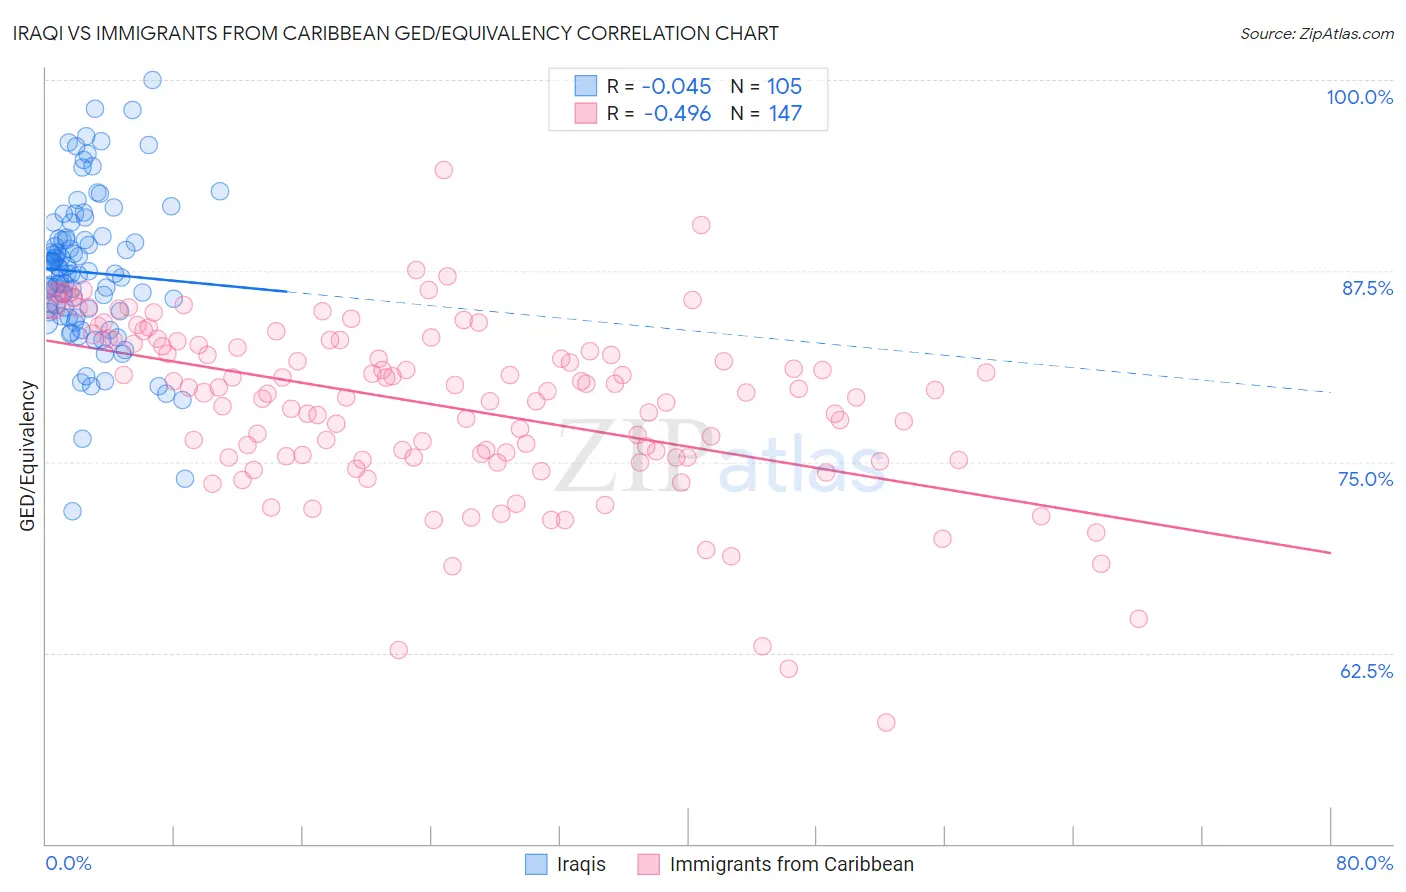
Iraqi vs Immigrants from Caribbean GED/Equivalency Correlation Chart
The statistical analysis conducted on geographies consisting of 170,614,457 people shows no correlation between the proportion of Iraqis and percentage of population with at least ged/equivalency education in the United States with a correlation coefficient (R) of -0.045 and weighted average of 86.2%. Similarly, the statistical analysis conducted on geographies consisting of 450,064,654 people shows a moderate negative correlation between the proportion of Immigrants from Caribbean and percentage of population with at least ged/equivalency education in the United States with a correlation coefficient (R) of -0.496 and weighted average of 80.5%, a difference of 7.1%.
GED/Equivalency Correlation Summary
| Measurement | Iraqi | Immigrants from Caribbean |
| Minimum | 71.8% | 58.0% |
| Maximum | 100.0% | 94.1% |
| Range | 28.2% | 36.2% |
| Mean | 87.4% | 78.7% |
| Median | 87.3% | 79.5% |
| Interquartile 25% (IQ1) | 84.7% | 75.3% |
| Interquartile 75% (IQ3) | 89.7% | 82.9% |
| Interquartile Range (IQR) | 5.0% | 7.6% |
| Standard Deviation (Sample) | 4.9% | 5.7% |
| Standard Deviation (Population) | 4.9% | 5.7% |
Similar Demographics by GED/Equivalency
Demographics Similar to Iraqis by GED/Equivalency
In terms of ged/equivalency, the demographic groups most similar to Iraqis are Armenian (86.3%, a difference of 0.030%), Kenyan (86.3%, a difference of 0.040%), Immigrants from Nepal (86.2%, a difference of 0.050%), Brazilian (86.3%, a difference of 0.060%), and Immigrants from Bosnia and Herzegovina (86.3%, a difference of 0.080%).
| Demographics | Rating | Rank | GED/Equivalency |
| Immigrants | Poland | 79.3 /100 | #148 | Good 86.3% |
| Menominee | 79.3 /100 | #149 | Good 86.3% |
| Immigrants | Western Asia | 78.8 /100 | #150 | Good 86.3% |
| Immigrants | Bosnia and Herzegovina | 77.9 /100 | #151 | Good 86.3% |
| Brazilians | 77.2 /100 | #152 | Good 86.3% |
| Kenyans | 76.6 /100 | #153 | Good 86.3% |
| Armenians | 76.4 /100 | #154 | Good 86.3% |
| Iraqis | 75.2 /100 | #155 | Good 86.2% |
| Immigrants | Nepal | 73.3 /100 | #156 | Good 86.2% |
| Whites/Caucasians | 72.2 /100 | #157 | Good 86.2% |
| German Russians | 72.1 /100 | #158 | Good 86.2% |
| Immigrants | Kenya | 71.8 /100 | #159 | Good 86.2% |
| Immigrants | Morocco | 69.5 /100 | #160 | Good 86.1% |
| Immigrants | Syria | 69.3 /100 | #161 | Good 86.1% |
| Immigrants | Iraq | 68.1 /100 | #162 | Good 86.1% |
Demographics Similar to Immigrants from Caribbean by GED/Equivalency
In terms of ged/equivalency, the demographic groups most similar to Immigrants from Caribbean are Yaqui (80.5%, a difference of 0.020%), Immigrants from Belize (80.5%, a difference of 0.020%), Central American Indian (80.6%, a difference of 0.10%), Apache (80.7%, a difference of 0.24%), and Immigrants from Cuba (80.2%, a difference of 0.43%).
| Demographics | Rating | Rank | GED/Equivalency |
| Immigrants | Guyana | 0.0 /100 | #310 | Tragic 81.0% |
| Natives/Alaskans | 0.0 /100 | #311 | Tragic 80.9% |
| Nicaraguans | 0.0 /100 | #312 | Tragic 80.9% |
| Cape Verdeans | 0.0 /100 | #313 | Tragic 80.9% |
| Belizeans | 0.0 /100 | #314 | Tragic 80.9% |
| Apache | 0.0 /100 | #315 | Tragic 80.7% |
| Central American Indians | 0.0 /100 | #316 | Tragic 80.6% |
| Immigrants | Caribbean | 0.0 /100 | #317 | Tragic 80.5% |
| Yaqui | 0.0 /100 | #318 | Tragic 80.5% |
| Immigrants | Belize | 0.0 /100 | #319 | Tragic 80.5% |
| Immigrants | Cuba | 0.0 /100 | #320 | Tragic 80.2% |
| Yup'ik | 0.0 /100 | #321 | Tragic 80.0% |
| Lumbee | 0.0 /100 | #322 | Tragic 80.0% |
| Immigrants | Nicaragua | 0.0 /100 | #323 | Tragic 79.9% |
| Mexican American Indians | 0.0 /100 | #324 | Tragic 79.4% |