Iraqi vs Immigrants from Caribbean Family Poverty
COMPARE
Iraqi
Immigrants from Caribbean
Family Poverty
Family Poverty Comparison
Iraqis
Immigrants from Caribbean
9.3%
FAMILY POVERTY
24.2/ 100
METRIC RATING
198th/ 347
METRIC RANK
12.2%
FAMILY POVERTY
0.0/ 100
METRIC RATING
313th/ 347
METRIC RANK
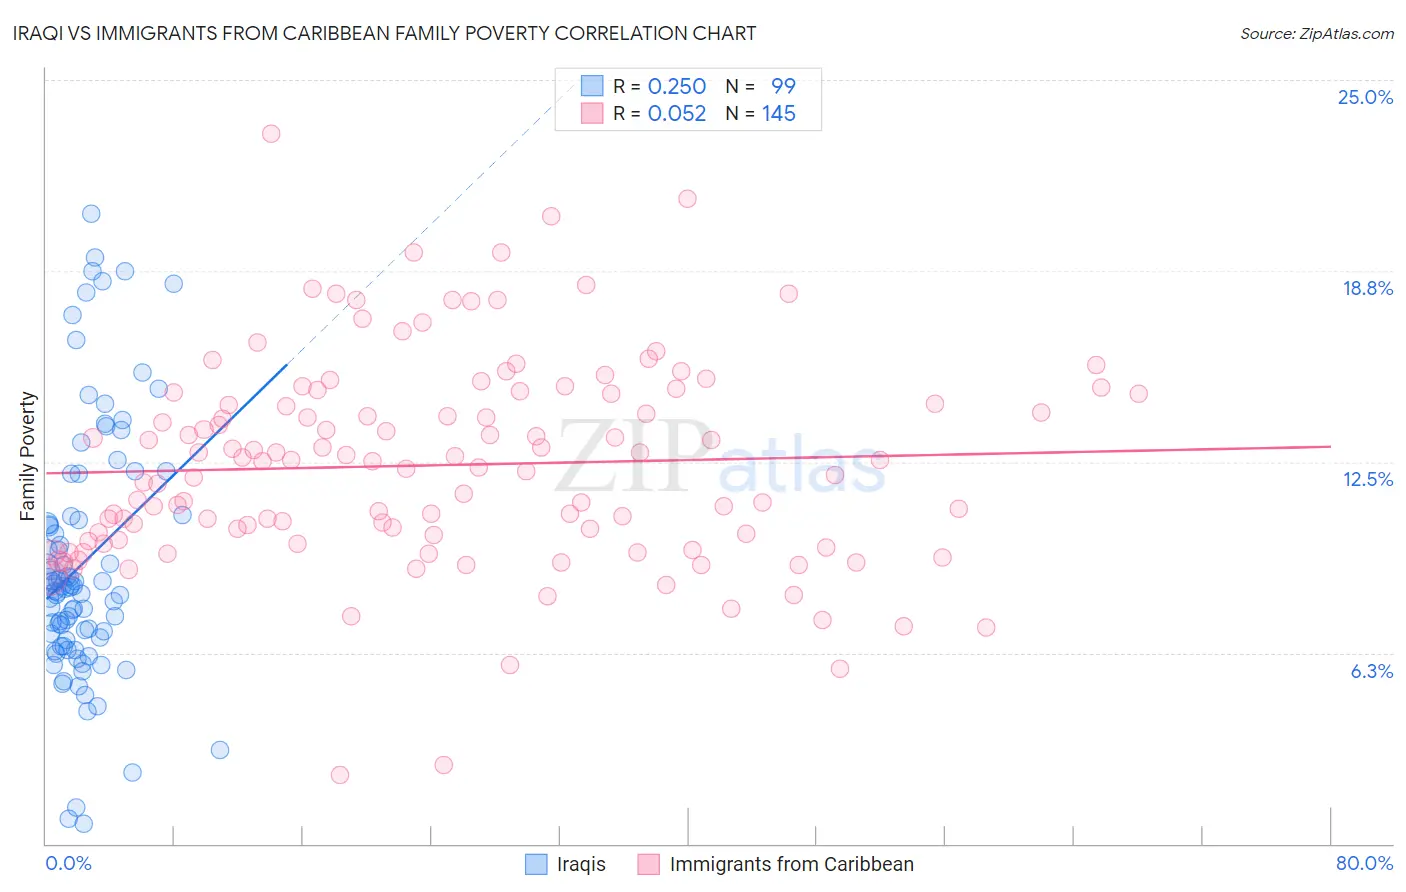
Iraqi vs Immigrants from Caribbean Family Poverty Correlation Chart
The statistical analysis conducted on geographies consisting of 170,433,754 people shows a weak positive correlation between the proportion of Iraqis and poverty level among families in the United States with a correlation coefficient (R) of 0.250 and weighted average of 9.3%. Similarly, the statistical analysis conducted on geographies consisting of 448,312,225 people shows a slight positive correlation between the proportion of Immigrants from Caribbean and poverty level among families in the United States with a correlation coefficient (R) of 0.052 and weighted average of 12.2%, a difference of 30.4%.
Family Poverty Correlation Summary
| Measurement | Iraqi | Immigrants from Caribbean |
| Minimum | 0.67% | 2.2% |
| Maximum | 20.6% | 23.2% |
| Range | 19.9% | 21.0% |
| Mean | 9.2% | 12.4% |
| Median | 8.4% | 12.5% |
| Interquartile 25% (IQ1) | 6.7% | 9.9% |
| Interquartile 75% (IQ3) | 10.7% | 14.7% |
| Interquartile Range (IQR) | 4.1% | 4.8% |
| Standard Deviation (Sample) | 4.1% | 3.4% |
| Standard Deviation (Population) | 4.1% | 3.4% |
Similar Demographics by Family Poverty
Demographics Similar to Iraqis by Family Poverty
In terms of family poverty, the demographic groups most similar to Iraqis are Immigrants from Colombia (9.3%, a difference of 0.030%), Spaniard (9.4%, a difference of 0.25%), Immigrants from Venezuela (9.3%, a difference of 0.32%), Immigrants from Costa Rica (9.4%, a difference of 0.44%), and Venezuelan (9.3%, a difference of 0.53%).
| Demographics | Rating | Rank | Family Poverty |
| Ugandans | 28.7 /100 | #191 | Fair 9.3% |
| Spanish | 28.7 /100 | #192 | Fair 9.3% |
| Immigrants | Western Asia | 28.2 /100 | #193 | Fair 9.3% |
| South Americans | 28.1 /100 | #194 | Fair 9.3% |
| Venezuelans | 27.4 /100 | #195 | Fair 9.3% |
| Immigrants | Venezuela | 26.1 /100 | #196 | Fair 9.3% |
| Immigrants | Colombia | 24.4 /100 | #197 | Fair 9.3% |
| Iraqis | 24.2 /100 | #198 | Fair 9.3% |
| Spaniards | 22.8 /100 | #199 | Fair 9.4% |
| Immigrants | Costa Rica | 21.7 /100 | #200 | Fair 9.4% |
| Immigrants | Portugal | 20.5 /100 | #201 | Fair 9.4% |
| Immigrants | Sierra Leone | 19.6 /100 | #202 | Poor 9.4% |
| German Russians | 19.4 /100 | #203 | Poor 9.4% |
| Immigrants | Lebanon | 18.9 /100 | #204 | Poor 9.4% |
| Aleuts | 18.0 /100 | #205 | Poor 9.5% |
Demographics Similar to Immigrants from Caribbean by Family Poverty
In terms of family poverty, the demographic groups most similar to Immigrants from Caribbean are Kiowa (12.2%, a difference of 0.50%), Immigrants from Central America (12.1%, a difference of 0.68%), Immigrants from Mexico (12.3%, a difference of 0.76%), Ute (12.1%, a difference of 1.1%), and Honduran (12.4%, a difference of 1.5%).
| Demographics | Rating | Rank | Family Poverty |
| Cajuns | 0.0 /100 | #306 | Tragic 11.9% |
| Immigrants | Congo | 0.0 /100 | #307 | Tragic 11.9% |
| Seminole | 0.0 /100 | #308 | Tragic 11.9% |
| Hispanics or Latinos | 0.0 /100 | #309 | Tragic 12.0% |
| Immigrants | Guatemala | 0.0 /100 | #310 | Tragic 12.0% |
| Ute | 0.0 /100 | #311 | Tragic 12.1% |
| Immigrants | Central America | 0.0 /100 | #312 | Tragic 12.1% |
| Immigrants | Caribbean | 0.0 /100 | #313 | Tragic 12.2% |
| Kiowa | 0.0 /100 | #314 | Tragic 12.2% |
| Immigrants | Mexico | 0.0 /100 | #315 | Tragic 12.3% |
| Hondurans | 0.0 /100 | #316 | Tragic 12.4% |
| Immigrants | Grenada | 0.0 /100 | #317 | Tragic 12.4% |
| U.S. Virgin Islanders | 0.0 /100 | #318 | Tragic 12.4% |
| British West Indians | 0.0 /100 | #319 | Tragic 12.4% |
| Inupiat | 0.0 /100 | #320 | Tragic 12.5% |