Hawaiian vs Peruvian Bachelor's Degree
COMPARE
Hawaiian
Peruvian
Bachelor's Degree
Bachelor's Degree Comparison
Hawaiians
Peruvians
31.6%
BACHELOR'S DEGREE
0.1/ 100
METRIC RATING
279th/ 347
METRIC RANK
38.3%
BACHELOR'S DEGREE
63.4/ 100
METRIC RATING
163rd/ 347
METRIC RANK
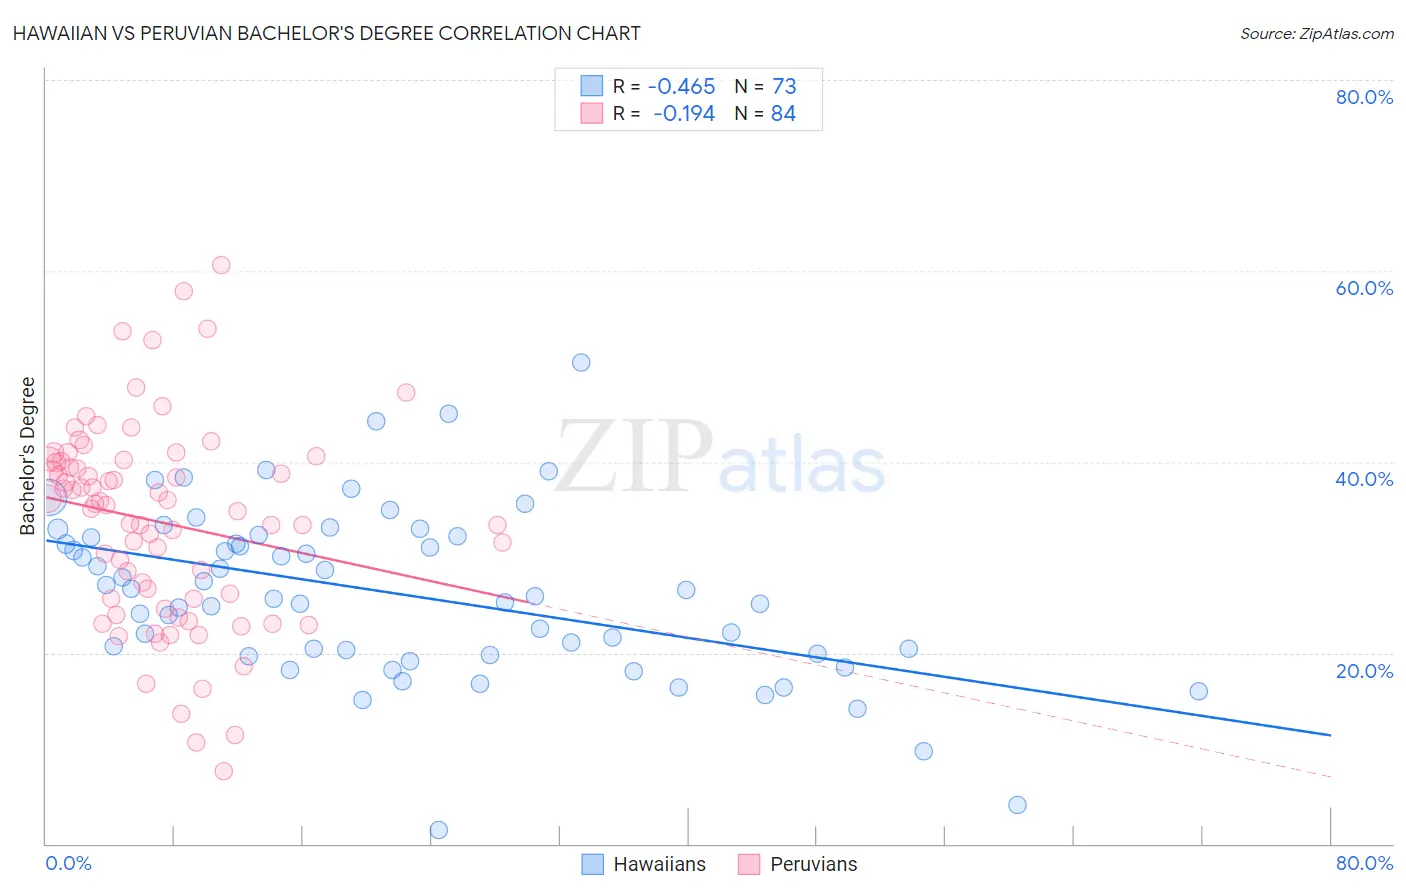
Hawaiian vs Peruvian Bachelor's Degree Correlation Chart
The statistical analysis conducted on geographies consisting of 327,580,632 people shows a moderate negative correlation between the proportion of Hawaiians and percentage of population with at least bachelor's degree education in the United States with a correlation coefficient (R) of -0.465 and weighted average of 31.6%. Similarly, the statistical analysis conducted on geographies consisting of 363,225,668 people shows a poor negative correlation between the proportion of Peruvians and percentage of population with at least bachelor's degree education in the United States with a correlation coefficient (R) of -0.194 and weighted average of 38.3%, a difference of 21.2%.
Bachelor's Degree Correlation Summary
| Measurement | Hawaiian | Peruvian |
| Minimum | 1.4% | 7.6% |
| Maximum | 50.4% | 60.7% |
| Range | 49.0% | 53.0% |
| Mean | 26.2% | 33.7% |
| Median | 26.0% | 35.6% |
| Interquartile 25% (IQ1) | 19.8% | 25.6% |
| Interquartile 75% (IQ3) | 32.1% | 40.1% |
| Interquartile Range (IQR) | 12.3% | 14.5% |
| Standard Deviation (Sample) | 8.9% | 10.5% |
| Standard Deviation (Population) | 8.9% | 10.5% |
Similar Demographics by Bachelor's Degree
Demographics Similar to Hawaiians by Bachelor's Degree
In terms of bachelor's degree, the demographic groups most similar to Hawaiians are Immigrants from Laos (31.6%, a difference of 0.050%), Marshallese (31.7%, a difference of 0.35%), Dominican (31.8%, a difference of 0.40%), Blackfeet (31.5%, a difference of 0.51%), and Salvadoran (31.8%, a difference of 0.55%).
| Demographics | Rating | Rank | Bachelor's Degree |
| Comanche | 0.2 /100 | #272 | Tragic 31.9% |
| Americans | 0.2 /100 | #273 | Tragic 31.9% |
| Potawatomi | 0.2 /100 | #274 | Tragic 31.9% |
| Samoans | 0.1 /100 | #275 | Tragic 31.8% |
| Salvadorans | 0.1 /100 | #276 | Tragic 31.8% |
| Dominicans | 0.1 /100 | #277 | Tragic 31.8% |
| Marshallese | 0.1 /100 | #278 | Tragic 31.7% |
| Hawaiians | 0.1 /100 | #279 | Tragic 31.6% |
| Immigrants | Laos | 0.1 /100 | #280 | Tragic 31.6% |
| Blackfeet | 0.1 /100 | #281 | Tragic 31.5% |
| Immigrants | Caribbean | 0.1 /100 | #282 | Tragic 31.4% |
| Hondurans | 0.1 /100 | #283 | Tragic 31.3% |
| Haitians | 0.1 /100 | #284 | Tragic 31.3% |
| Aleuts | 0.1 /100 | #285 | Tragic 31.3% |
| Immigrants | El Salvador | 0.1 /100 | #286 | Tragic 31.3% |
Demographics Similar to Peruvians by Bachelor's Degree
In terms of bachelor's degree, the demographic groups most similar to Peruvians are Hungarian (38.3%, a difference of 0.14%), Colombian (38.4%, a difference of 0.17%), Uruguayan (38.4%, a difference of 0.25%), Vietnamese (38.5%, a difference of 0.33%), and Chinese (38.5%, a difference of 0.34%).
| Demographics | Rating | Rank | Bachelor's Degree |
| Kenyans | 72.5 /100 | #156 | Good 38.7% |
| Immigrants | South America | 70.1 /100 | #157 | Good 38.6% |
| Immigrants | Germany | 69.6 /100 | #158 | Good 38.6% |
| Chinese | 66.6 /100 | #159 | Good 38.5% |
| Vietnamese | 66.6 /100 | #160 | Good 38.5% |
| Uruguayans | 65.8 /100 | #161 | Good 38.4% |
| Colombians | 65.0 /100 | #162 | Good 38.4% |
| Peruvians | 63.4 /100 | #163 | Good 38.3% |
| Hungarians | 62.1 /100 | #164 | Good 38.3% |
| Sri Lankans | 59.1 /100 | #165 | Average 38.2% |
| Somalis | 58.6 /100 | #166 | Average 38.1% |
| Scottish | 56.6 /100 | #167 | Average 38.1% |
| Danes | 56.2 /100 | #168 | Average 38.1% |
| Ghanaians | 55.3 /100 | #169 | Average 38.0% |
| Czechs | 54.4 /100 | #170 | Average 38.0% |