Immigrants from Cambodia vs Peruvian Bachelor's Degree
COMPARE
Immigrants from Cambodia
Peruvian
Bachelor's Degree
Bachelor's Degree Comparison
Immigrants from Cambodia
Peruvians
34.2%
BACHELOR'S DEGREE
1.9/ 100
METRIC RATING
241st/ 347
METRIC RANK
38.3%
BACHELOR'S DEGREE
63.4/ 100
METRIC RATING
163rd/ 347
METRIC RANK
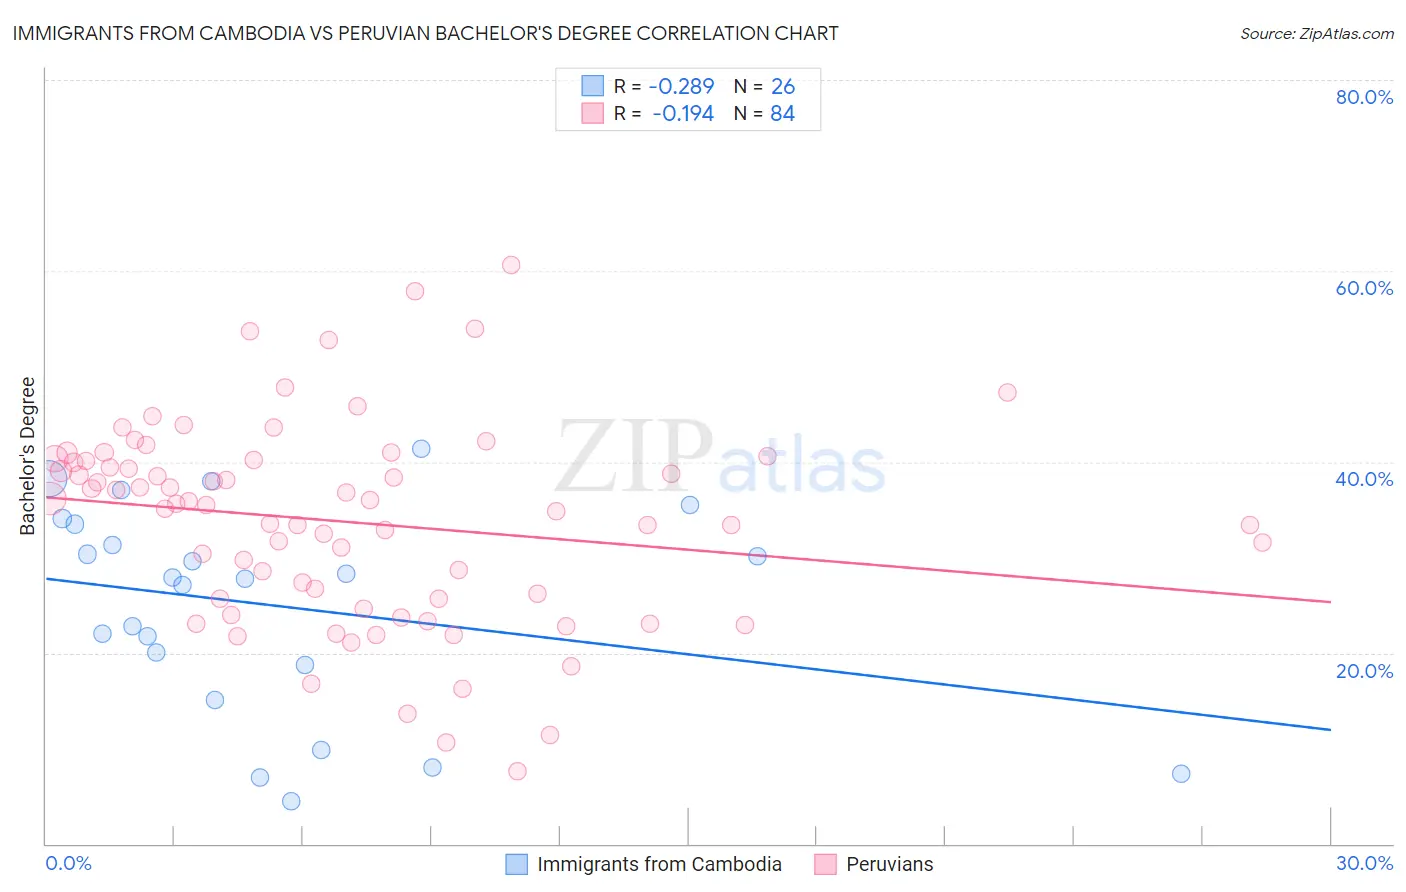
Immigrants from Cambodia vs Peruvian Bachelor's Degree Correlation Chart
The statistical analysis conducted on geographies consisting of 205,152,160 people shows a weak negative correlation between the proportion of Immigrants from Cambodia and percentage of population with at least bachelor's degree education in the United States with a correlation coefficient (R) of -0.289 and weighted average of 34.2%. Similarly, the statistical analysis conducted on geographies consisting of 363,225,668 people shows a poor negative correlation between the proportion of Peruvians and percentage of population with at least bachelor's degree education in the United States with a correlation coefficient (R) of -0.194 and weighted average of 38.3%, a difference of 12.1%.
Bachelor's Degree Correlation Summary
| Measurement | Immigrants from Cambodia | Peruvian |
| Minimum | 4.5% | 7.6% |
| Maximum | 41.4% | 60.7% |
| Range | 36.9% | 53.0% |
| Mean | 24.9% | 33.7% |
| Median | 27.9% | 35.6% |
| Interquartile 25% (IQ1) | 18.8% | 25.6% |
| Interquartile 75% (IQ3) | 33.5% | 40.1% |
| Interquartile Range (IQR) | 14.7% | 14.5% |
| Standard Deviation (Sample) | 10.8% | 10.5% |
| Standard Deviation (Population) | 10.6% | 10.5% |
Similar Demographics by Bachelor's Degree
Demographics Similar to Immigrants from Cambodia by Bachelor's Degree
In terms of bachelor's degree, the demographic groups most similar to Immigrants from Cambodia are Nonimmigrants (34.2%, a difference of 0.060%), Tongan (34.3%, a difference of 0.26%), Immigrants from Guyana (33.9%, a difference of 0.71%), British West Indian (34.5%, a difference of 0.80%), and Guyanese (34.5%, a difference of 0.82%).
| Demographics | Rating | Rank | Bachelor's Degree |
| Guamanians/Chamorros | 3.0 /100 | #234 | Tragic 34.6% |
| Immigrants | West Indies | 2.9 /100 | #235 | Tragic 34.6% |
| Liberians | 2.8 /100 | #236 | Tragic 34.6% |
| Tlingit-Haida | 2.8 /100 | #237 | Tragic 34.6% |
| Guyanese | 2.5 /100 | #238 | Tragic 34.5% |
| British West Indians | 2.5 /100 | #239 | Tragic 34.5% |
| Tongans | 2.0 /100 | #240 | Tragic 34.3% |
| Immigrants | Cambodia | 1.9 /100 | #241 | Tragic 34.2% |
| Immigrants | Nonimmigrants | 1.8 /100 | #242 | Tragic 34.2% |
| Immigrants | Guyana | 1.4 /100 | #243 | Tragic 33.9% |
| Delaware | 1.2 /100 | #244 | Tragic 33.8% |
| Immigrants | Fiji | 1.2 /100 | #245 | Tragic 33.7% |
| Jamaicans | 1.0 /100 | #246 | Tragic 33.6% |
| Immigrants | Congo | 1.0 /100 | #247 | Tragic 33.6% |
| Cree | 1.0 /100 | #248 | Tragic 33.6% |
Demographics Similar to Peruvians by Bachelor's Degree
In terms of bachelor's degree, the demographic groups most similar to Peruvians are Hungarian (38.3%, a difference of 0.14%), Colombian (38.4%, a difference of 0.17%), Uruguayan (38.4%, a difference of 0.25%), Vietnamese (38.5%, a difference of 0.33%), and Chinese (38.5%, a difference of 0.34%).
| Demographics | Rating | Rank | Bachelor's Degree |
| Kenyans | 72.5 /100 | #156 | Good 38.7% |
| Immigrants | South America | 70.1 /100 | #157 | Good 38.6% |
| Immigrants | Germany | 69.6 /100 | #158 | Good 38.6% |
| Chinese | 66.6 /100 | #159 | Good 38.5% |
| Vietnamese | 66.6 /100 | #160 | Good 38.5% |
| Uruguayans | 65.8 /100 | #161 | Good 38.4% |
| Colombians | 65.0 /100 | #162 | Good 38.4% |
| Peruvians | 63.4 /100 | #163 | Good 38.3% |
| Hungarians | 62.1 /100 | #164 | Good 38.3% |
| Sri Lankans | 59.1 /100 | #165 | Average 38.2% |
| Somalis | 58.6 /100 | #166 | Average 38.1% |
| Scottish | 56.6 /100 | #167 | Average 38.1% |
| Danes | 56.2 /100 | #168 | Average 38.1% |
| Ghanaians | 55.3 /100 | #169 | Average 38.0% |
| Czechs | 54.4 /100 | #170 | Average 38.0% |