Iranian vs Swiss High School Diploma
COMPARE
Iranian
Swiss
High School Diploma
High School Diploma Comparison
Iranians
Swiss
91.4%
HIGH SCHOOL DIPLOMA
99.9/ 100
METRIC RATING
30th/ 347
METRIC RANK
90.6%
HIGH SCHOOL DIPLOMA
98.6/ 100
METRIC RATING
92nd/ 347
METRIC RANK
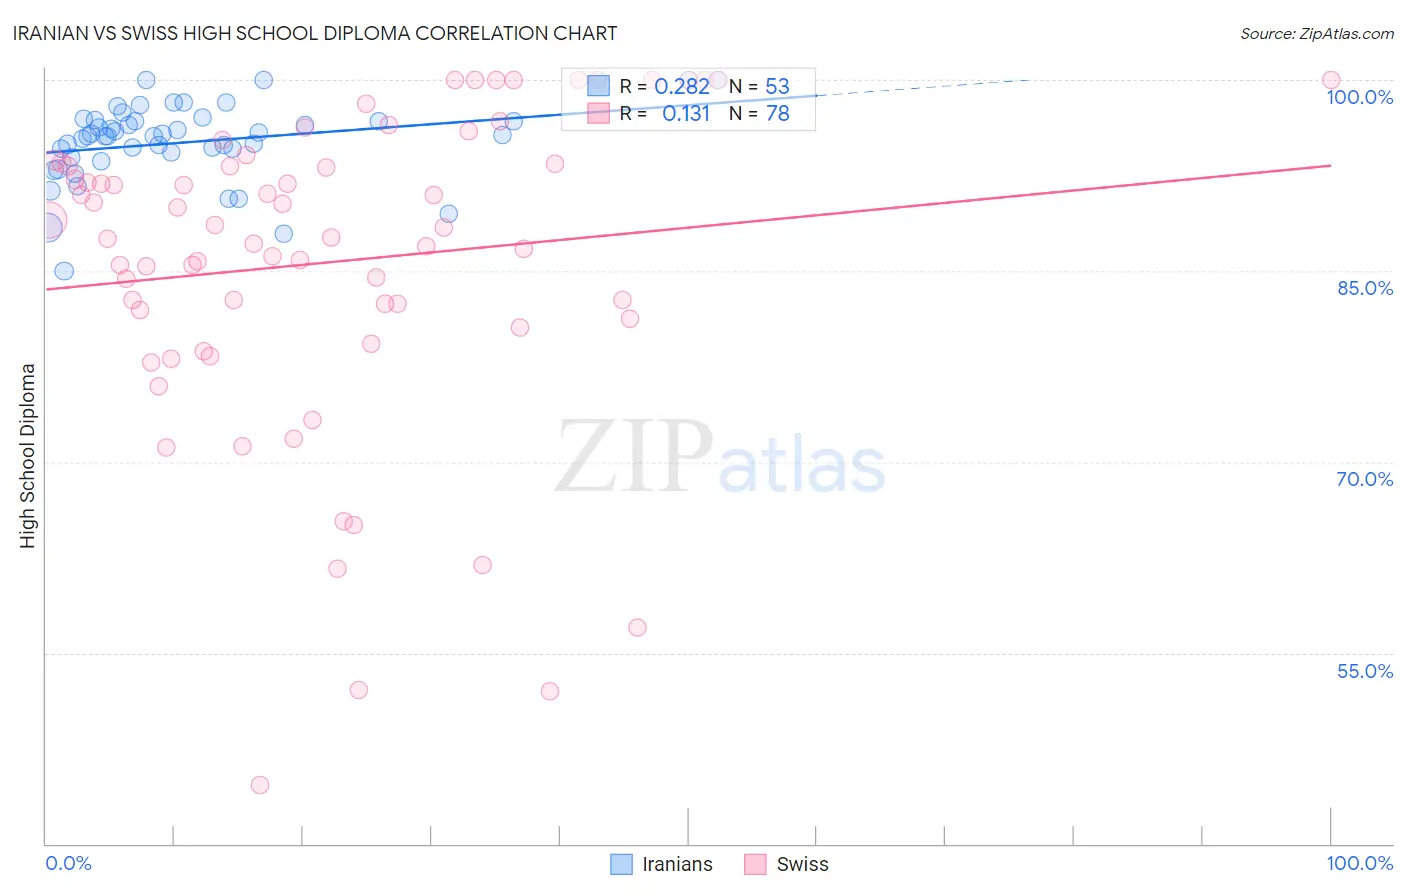
Iranian vs Swiss High School Diploma Correlation Chart
The statistical analysis conducted on geographies consisting of 316,901,778 people shows a weak positive correlation between the proportion of Iranians and percentage of population with at least high school diploma education in the United States with a correlation coefficient (R) of 0.282 and weighted average of 91.4%. Similarly, the statistical analysis conducted on geographies consisting of 465,022,572 people shows a poor positive correlation between the proportion of Swiss and percentage of population with at least high school diploma education in the United States with a correlation coefficient (R) of 0.131 and weighted average of 90.6%, a difference of 0.94%.
High School Diploma Correlation Summary
| Measurement | Iranian | Swiss |
| Minimum | 85.0% | 44.6% |
| Maximum | 100.0% | 100.0% |
| Range | 15.0% | 55.4% |
| Mean | 95.1% | 85.7% |
| Median | 95.6% | 88.0% |
| Interquartile 25% (IQ1) | 94.1% | 81.2% |
| Interquartile 75% (IQ3) | 96.8% | 93.5% |
| Interquartile Range (IQR) | 2.7% | 12.2% |
| Standard Deviation (Sample) | 3.1% | 12.4% |
| Standard Deviation (Population) | 3.0% | 12.3% |
Similar Demographics by High School Diploma
Demographics Similar to Iranians by High School Diploma
In terms of high school diploma, the demographic groups most similar to Iranians are European (91.4%, a difference of 0.010%), Immigrants from Northern Europe (91.4%, a difference of 0.010%), English (91.4%, a difference of 0.010%), Okinawan (91.4%, a difference of 0.010%), and Scottish (91.4%, a difference of 0.020%).
| Demographics | Rating | Rank | High School Diploma |
| Scandinavians | 99.9 /100 | #23 | Exceptional 91.5% |
| Italians | 99.9 /100 | #24 | Exceptional 91.5% |
| Thais | 99.9 /100 | #25 | Exceptional 91.5% |
| Russians | 99.9 /100 | #26 | Exceptional 91.5% |
| Cypriots | 99.9 /100 | #27 | Exceptional 91.5% |
| Tlingit-Haida | 99.9 /100 | #28 | Exceptional 91.4% |
| Europeans | 99.9 /100 | #29 | Exceptional 91.4% |
| Iranians | 99.9 /100 | #30 | Exceptional 91.4% |
| Immigrants | Northern Europe | 99.9 /100 | #31 | Exceptional 91.4% |
| English | 99.9 /100 | #32 | Exceptional 91.4% |
| Okinawans | 99.9 /100 | #33 | Exceptional 91.4% |
| Scottish | 99.9 /100 | #34 | Exceptional 91.4% |
| Irish | 99.9 /100 | #35 | Exceptional 91.4% |
| Tsimshian | 99.9 /100 | #36 | Exceptional 91.3% |
| Immigrants | Ireland | 99.9 /100 | #37 | Exceptional 91.3% |
Demographics Similar to Swiss by High School Diploma
In terms of high school diploma, the demographic groups most similar to Swiss are Immigrants from Western Europe (90.6%, a difference of 0.0%), South African (90.6%, a difference of 0.010%), Immigrants from Israel (90.5%, a difference of 0.020%), Celtic (90.6%, a difference of 0.030%), and Icelander (90.5%, a difference of 0.030%).
| Demographics | Rating | Rank | High School Diploma |
| Romanians | 98.9 /100 | #85 | Exceptional 90.7% |
| Immigrants | Bulgaria | 98.9 /100 | #86 | Exceptional 90.6% |
| Immigrants | Turkey | 98.9 /100 | #87 | Exceptional 90.6% |
| Immigrants | France | 98.8 /100 | #88 | Exceptional 90.6% |
| Canadians | 98.7 /100 | #89 | Exceptional 90.6% |
| Celtics | 98.7 /100 | #90 | Exceptional 90.6% |
| South Africans | 98.6 /100 | #91 | Exceptional 90.6% |
| Swiss | 98.6 /100 | #92 | Exceptional 90.6% |
| Immigrants | Western Europe | 98.6 /100 | #93 | Exceptional 90.6% |
| Immigrants | Israel | 98.5 /100 | #94 | Exceptional 90.5% |
| Icelanders | 98.5 /100 | #95 | Exceptional 90.5% |
| Immigrants | Serbia | 98.4 /100 | #96 | Exceptional 90.5% |
| Immigrants | Kuwait | 98.3 /100 | #97 | Exceptional 90.5% |
| Immigrants | Korea | 98.3 /100 | #98 | Exceptional 90.5% |
| Immigrants | Europe | 98.2 /100 | #99 | Exceptional 90.5% |