Danish vs Immigrants from Senegal Bachelor's Degree
COMPARE
Danish
Immigrants from Senegal
Bachelor's Degree
Bachelor's Degree Comparison
Danes
Immigrants from Senegal
38.1%
BACHELOR'S DEGREE
56.2/ 100
METRIC RATING
168th/ 347
METRIC RANK
37.6%
BACHELOR'S DEGREE
43.8/ 100
METRIC RATING
181st/ 347
METRIC RANK
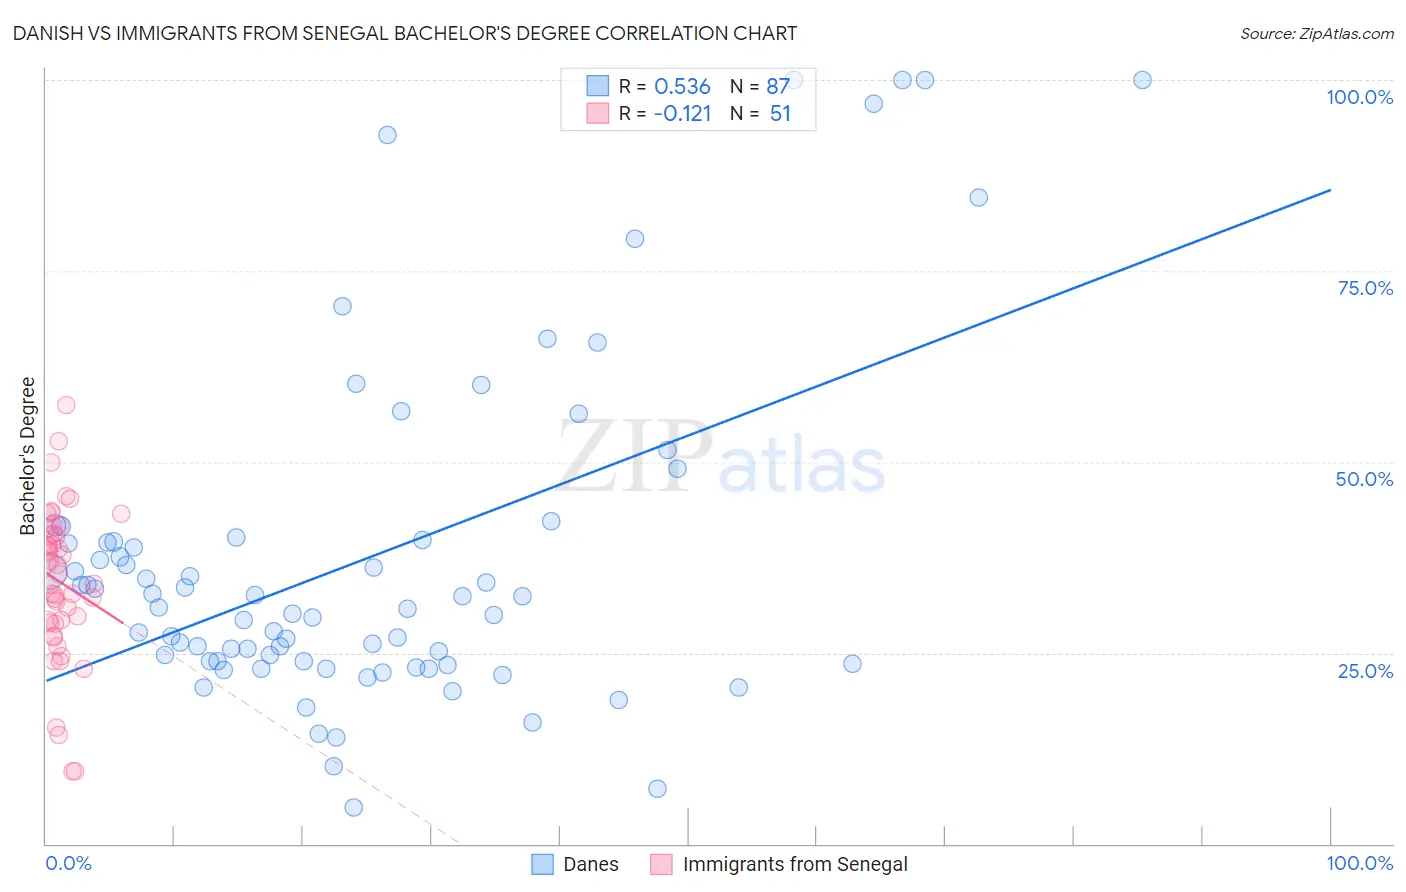
Danish vs Immigrants from Senegal Bachelor's Degree Correlation Chart
The statistical analysis conducted on geographies consisting of 474,149,841 people shows a substantial positive correlation between the proportion of Danes and percentage of population with at least bachelor's degree education in the United States with a correlation coefficient (R) of 0.536 and weighted average of 38.1%. Similarly, the statistical analysis conducted on geographies consisting of 90,125,204 people shows a poor negative correlation between the proportion of Immigrants from Senegal and percentage of population with at least bachelor's degree education in the United States with a correlation coefficient (R) of -0.121 and weighted average of 37.6%, a difference of 1.2%.
Bachelor's Degree Correlation Summary
| Measurement | Danish | Immigrants from Senegal |
| Minimum | 4.8% | 9.5% |
| Maximum | 100.0% | 57.5% |
| Range | 95.2% | 48.0% |
| Mean | 37.4% | 34.3% |
| Median | 31.0% | 35.4% |
| Interquartile 25% (IQ1) | 23.9% | 29.0% |
| Interquartile 75% (IQ3) | 39.8% | 40.6% |
| Interquartile Range (IQR) | 15.9% | 11.6% |
| Standard Deviation (Sample) | 22.1% | 9.9% |
| Standard Deviation (Population) | 22.0% | 9.8% |
Demographics Similar to Danes and Immigrants from Senegal by Bachelor's Degree
In terms of bachelor's degree, the demographic groups most similar to Danes are Scottish (38.1%, a difference of 0.030%), Ghanaian (38.0%, a difference of 0.090%), Czech (38.0%, a difference of 0.18%), Bermudan (38.0%, a difference of 0.20%), and Somali (38.1%, a difference of 0.24%). Similarly, the demographic groups most similar to Immigrants from Senegal are Immigrants from Bosnia and Herzegovina (37.6%, a difference of 0.030%), Irish (37.6%, a difference of 0.050%), Immigrants from Colombia (37.7%, a difference of 0.16%), Senegalese (37.5%, a difference of 0.16%), and Scandinavian (37.5%, a difference of 0.20%).
| Demographics | Rating | Rank | Bachelor's Degree |
| Hungarians | 62.1 /100 | #164 | Good 38.3% |
| Sri Lankans | 59.1 /100 | #165 | Average 38.2% |
| Somalis | 58.6 /100 | #166 | Average 38.1% |
| Scottish | 56.6 /100 | #167 | Average 38.1% |
| Danes | 56.2 /100 | #168 | Average 38.1% |
| Ghanaians | 55.3 /100 | #169 | Average 38.0% |
| Czechs | 54.4 /100 | #170 | Average 38.0% |
| Bermudans | 54.2 /100 | #171 | Average 38.0% |
| Immigrants | Somalia | 52.8 /100 | #172 | Average 37.9% |
| Immigrants | Iraq | 52.5 /100 | #173 | Average 37.9% |
| Immigrants | Bangladesh | 50.0 /100 | #174 | Average 37.8% |
| Immigrants | Uruguay | 48.3 /100 | #175 | Average 37.8% |
| Costa Ricans | 47.6 /100 | #176 | Average 37.7% |
| Basques | 47.4 /100 | #177 | Average 37.7% |
| Immigrants | Cameroon | 46.8 /100 | #178 | Average 37.7% |
| Immigrants | Colombia | 45.4 /100 | #179 | Average 37.7% |
| Irish | 44.3 /100 | #180 | Average 37.6% |
| Immigrants | Senegal | 43.8 /100 | #181 | Average 37.6% |
| Immigrants | Bosnia and Herzegovina | 43.4 /100 | #182 | Average 37.6% |
| Senegalese | 42.2 /100 | #183 | Average 37.5% |
| Scandinavians | 41.7 /100 | #184 | Average 37.5% |