Iranian vs Immigrants from Senegal Unemployment Among Women with Children Ages 6 to 17 years
COMPARE
Iranian
Immigrants from Senegal
Unemployment Among Women with Children Ages 6 to 17 years
Unemployment Among Women with Children Ages 6 to 17 years Comparison
Iranians
Immigrants from Senegal
8.0%
UNEMPLOYMENT AMONG WOMEN WITH CHILDREN AGES 6 TO 17 YEARS
100.0/ 100
METRIC RATING
41st/ 347
METRIC RANK
10.2%
UNEMPLOYMENT AMONG WOMEN WITH CHILDREN AGES 6 TO 17 YEARS
0.0/ 100
METRIC RATING
307th/ 347
METRIC RANK
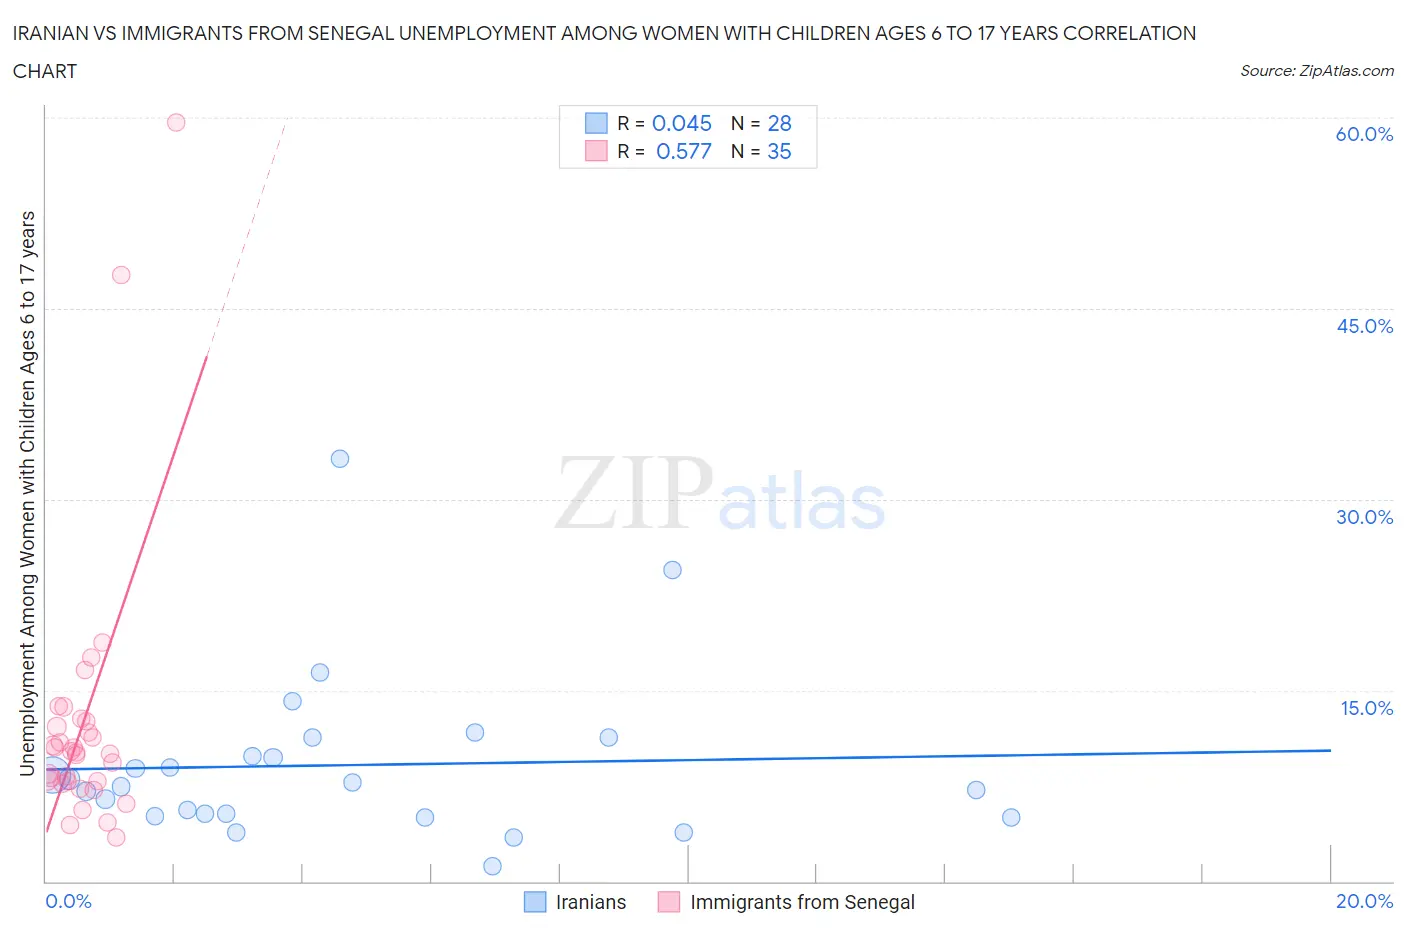
Iranian vs Immigrants from Senegal Unemployment Among Women with Children Ages 6 to 17 years Correlation Chart
The statistical analysis conducted on geographies consisting of 238,016,726 people shows no correlation between the proportion of Iranians and unemployment rate among women with children between the ages 6 and 17 in the United States with a correlation coefficient (R) of 0.045 and weighted average of 8.0%. Similarly, the statistical analysis conducted on geographies consisting of 80,966,607 people shows a substantial positive correlation between the proportion of Immigrants from Senegal and unemployment rate among women with children between the ages 6 and 17 in the United States with a correlation coefficient (R) of 0.577 and weighted average of 10.2%, a difference of 27.7%.
Unemployment Among Women with Children Ages 6 to 17 years Correlation Summary
| Measurement | Iranian | Immigrants from Senegal |
| Minimum | 1.2% | 3.4% |
| Maximum | 33.2% | 59.6% |
| Range | 32.0% | 56.2% |
| Mean | 9.1% | 12.4% |
| Median | 7.6% | 10.1% |
| Interquartile 25% (IQ1) | 5.2% | 7.8% |
| Interquartile 75% (IQ3) | 10.6% | 12.5% |
| Interquartile Range (IQR) | 5.4% | 4.7% |
| Standard Deviation (Sample) | 6.6% | 11.0% |
| Standard Deviation (Population) | 6.5% | 10.8% |
Similar Demographics by Unemployment Among Women with Children Ages 6 to 17 years
Demographics Similar to Iranians by Unemployment Among Women with Children Ages 6 to 17 years
In terms of unemployment among women with children ages 6 to 17 years, the demographic groups most similar to Iranians are Immigrants from Zimbabwe (8.0%, a difference of 0.070%), Immigrants from Somalia (8.0%, a difference of 0.27%), Somali (8.0%, a difference of 0.36%), Bhutanese (8.1%, a difference of 0.41%), and Immigrants from Sweden (8.1%, a difference of 0.45%).
| Demographics | Rating | Rank | Unemployment Among Women with Children Ages 6 to 17 years |
| Native Hawaiians | 100.0 /100 | #34 | Exceptional 7.9% |
| Immigrants | South Central Asia | 100.0 /100 | #35 | Exceptional 7.9% |
| Burmese | 100.0 /100 | #36 | Exceptional 8.0% |
| Asians | 100.0 /100 | #37 | Exceptional 8.0% |
| Alsatians | 100.0 /100 | #38 | Exceptional 8.0% |
| Somalis | 100.0 /100 | #39 | Exceptional 8.0% |
| Immigrants | Zimbabwe | 100.0 /100 | #40 | Exceptional 8.0% |
| Iranians | 100.0 /100 | #41 | Exceptional 8.0% |
| Immigrants | Somalia | 100.0 /100 | #42 | Exceptional 8.0% |
| Bhutanese | 100.0 /100 | #43 | Exceptional 8.1% |
| Immigrants | Sweden | 100.0 /100 | #44 | Exceptional 8.1% |
| Immigrants | Bulgaria | 100.0 /100 | #45 | Exceptional 8.1% |
| Icelanders | 100.0 /100 | #46 | Exceptional 8.1% |
| Immigrants | Switzerland | 100.0 /100 | #47 | Exceptional 8.1% |
| Immigrants | Asia | 100.0 /100 | #48 | Exceptional 8.1% |
Demographics Similar to Immigrants from Senegal by Unemployment Among Women with Children Ages 6 to 17 years
In terms of unemployment among women with children ages 6 to 17 years, the demographic groups most similar to Immigrants from Senegal are Dutch West Indian (10.2%, a difference of 0.010%), Paraguayan (10.2%, a difference of 0.23%), Immigrants from Nigeria (10.2%, a difference of 0.52%), French Canadian (10.3%, a difference of 0.55%), and Immigrants from Venezuela (10.2%, a difference of 0.57%).
| Demographics | Rating | Rank | Unemployment Among Women with Children Ages 6 to 17 years |
| Nigerians | 0.0 /100 | #300 | Tragic 10.1% |
| Immigrants | Bahamas | 0.0 /100 | #301 | Tragic 10.1% |
| Venezuelans | 0.0 /100 | #302 | Tragic 10.2% |
| Immigrants | Ecuador | 0.0 /100 | #303 | Tragic 10.2% |
| Immigrants | Venezuela | 0.0 /100 | #304 | Tragic 10.2% |
| Immigrants | Nigeria | 0.0 /100 | #305 | Tragic 10.2% |
| Paraguayans | 0.0 /100 | #306 | Tragic 10.2% |
| Immigrants | Senegal | 0.0 /100 | #307 | Tragic 10.2% |
| Dutch West Indians | 0.0 /100 | #308 | Tragic 10.2% |
| French Canadians | 0.0 /100 | #309 | Tragic 10.3% |
| Alaska Natives | 0.0 /100 | #310 | Tragic 10.3% |
| Immigrants | Liberia | 0.0 /100 | #311 | Tragic 10.3% |
| Africans | 0.0 /100 | #312 | Tragic 10.4% |
| Americans | 0.0 /100 | #313 | Tragic 10.4% |
| Immigrants | Cabo Verde | 0.0 /100 | #314 | Tragic 10.4% |