Iranian vs Immigrants from Portugal Associate's Degree
COMPARE
Iranian
Immigrants from Portugal
Associate's Degree
Associate's Degree Comparison
Iranians
Immigrants from Portugal
58.2%
ASSOCIATE'S DEGREE
100.0/ 100
METRIC RATING
5th/ 347
METRIC RANK
40.1%
ASSOCIATE'S DEGREE
0.1/ 100
METRIC RATING
281st/ 347
METRIC RANK
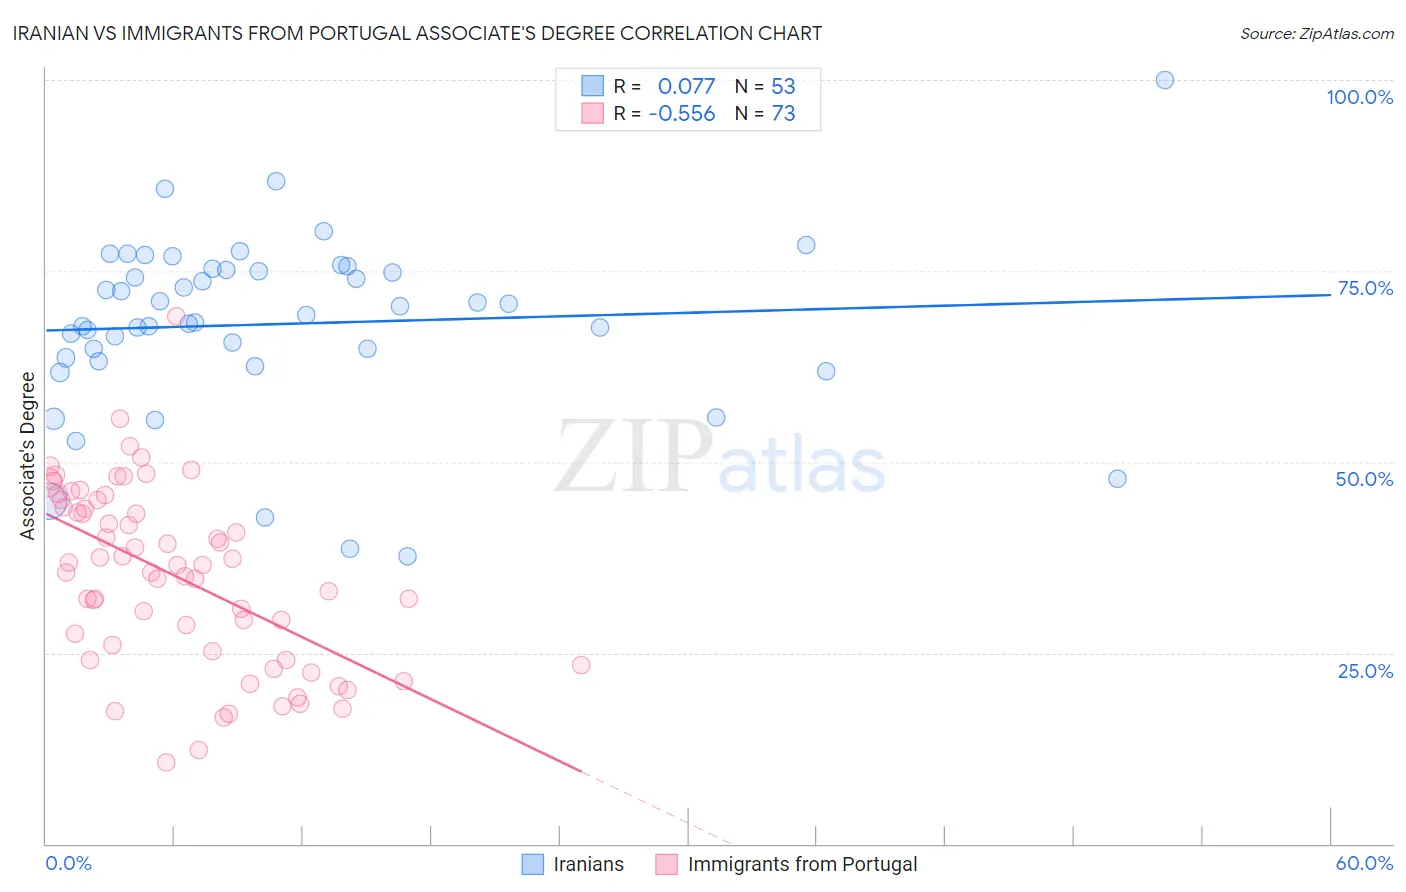
Iranian vs Immigrants from Portugal Associate's Degree Correlation Chart
The statistical analysis conducted on geographies consisting of 316,879,465 people shows a slight positive correlation between the proportion of Iranians and percentage of population with at least associate's degree education in the United States with a correlation coefficient (R) of 0.077 and weighted average of 58.2%. Similarly, the statistical analysis conducted on geographies consisting of 174,792,107 people shows a substantial negative correlation between the proportion of Immigrants from Portugal and percentage of population with at least associate's degree education in the United States with a correlation coefficient (R) of -0.556 and weighted average of 40.1%, a difference of 44.9%.
Associate's Degree Correlation Summary
| Measurement | Iranian | Immigrants from Portugal |
| Minimum | 37.7% | 10.6% |
| Maximum | 100.0% | 69.0% |
| Range | 62.3% | 58.4% |
| Mean | 68.1% | 35.1% |
| Median | 69.2% | 36.6% |
| Interquartile 25% (IQ1) | 63.4% | 24.6% |
| Interquartile 75% (IQ3) | 75.2% | 44.5% |
| Interquartile Range (IQR) | 11.8% | 19.9% |
| Standard Deviation (Sample) | 11.7% | 11.8% |
| Standard Deviation (Population) | 11.6% | 11.7% |
Similar Demographics by Associate's Degree
Demographics Similar to Iranians by Associate's Degree
In terms of associate's degree, the demographic groups most similar to Iranians are Immigrants from Taiwan (58.4%, a difference of 0.41%), Immigrants from India (58.5%, a difference of 0.66%), Okinawan (57.7%, a difference of 0.83%), Immigrants from Iran (57.7%, a difference of 0.89%), and Thai (57.4%, a difference of 1.3%).
| Demographics | Rating | Rank | Associate's Degree |
| Filipinos | 100.0 /100 | #1 | Exceptional 59.8% |
| Immigrants | Singapore | 100.0 /100 | #2 | Exceptional 58.9% |
| Immigrants | India | 100.0 /100 | #3 | Exceptional 58.5% |
| Immigrants | Taiwan | 100.0 /100 | #4 | Exceptional 58.4% |
| Iranians | 100.0 /100 | #5 | Exceptional 58.2% |
| Okinawans | 100.0 /100 | #6 | Exceptional 57.7% |
| Immigrants | Iran | 100.0 /100 | #7 | Exceptional 57.7% |
| Thais | 100.0 /100 | #8 | Exceptional 57.4% |
| Immigrants | Israel | 100.0 /100 | #9 | Exceptional 56.8% |
| Cypriots | 100.0 /100 | #10 | Exceptional 56.4% |
| Immigrants | Australia | 100.0 /100 | #11 | Exceptional 55.8% |
| Immigrants | South Central Asia | 100.0 /100 | #12 | Exceptional 55.7% |
| Immigrants | China | 100.0 /100 | #13 | Exceptional 55.5% |
| Immigrants | Hong Kong | 100.0 /100 | #14 | Exceptional 55.4% |
| Immigrants | Eastern Asia | 100.0 /100 | #15 | Exceptional 55.4% |
Demographics Similar to Immigrants from Portugal by Associate's Degree
In terms of associate's degree, the demographic groups most similar to Immigrants from Portugal are Immigrants from Micronesia (40.2%, a difference of 0.10%), Immigrants from Nicaragua (40.3%, a difference of 0.30%), Bangladeshi (40.0%, a difference of 0.31%), Ottawa (40.3%, a difference of 0.34%), and Haitian (40.0%, a difference of 0.46%).
| Demographics | Rating | Rank | Associate's Degree |
| Immigrants | Dominica | 0.1 /100 | #274 | Tragic 40.5% |
| Potawatomi | 0.1 /100 | #275 | Tragic 40.4% |
| Puerto Ricans | 0.1 /100 | #276 | Tragic 40.4% |
| Blackfeet | 0.1 /100 | #277 | Tragic 40.3% |
| Ottawa | 0.1 /100 | #278 | Tragic 40.3% |
| Immigrants | Nicaragua | 0.1 /100 | #279 | Tragic 40.3% |
| Immigrants | Micronesia | 0.1 /100 | #280 | Tragic 40.2% |
| Immigrants | Portugal | 0.1 /100 | #281 | Tragic 40.1% |
| Bangladeshis | 0.1 /100 | #282 | Tragic 40.0% |
| Haitians | 0.1 /100 | #283 | Tragic 40.0% |
| Comanche | 0.1 /100 | #284 | Tragic 39.9% |
| Immigrants | Belize | 0.1 /100 | #285 | Tragic 39.9% |
| Immigrants | Caribbean | 0.0 /100 | #286 | Tragic 39.7% |
| Aleuts | 0.0 /100 | #287 | Tragic 39.6% |
| Immigrants | Cuba | 0.0 /100 | #288 | Tragic 39.5% |