Iranian vs Immigrants from Grenada Associate's Degree
COMPARE
Iranian
Immigrants from Grenada
Associate's Degree
Associate's Degree Comparison
Iranians
Immigrants from Grenada
58.2%
ASSOCIATE'S DEGREE
100.0/ 100
METRIC RATING
5th/ 347
METRIC RANK
42.6%
ASSOCIATE'S DEGREE
1.3/ 100
METRIC RATING
239th/ 347
METRIC RANK
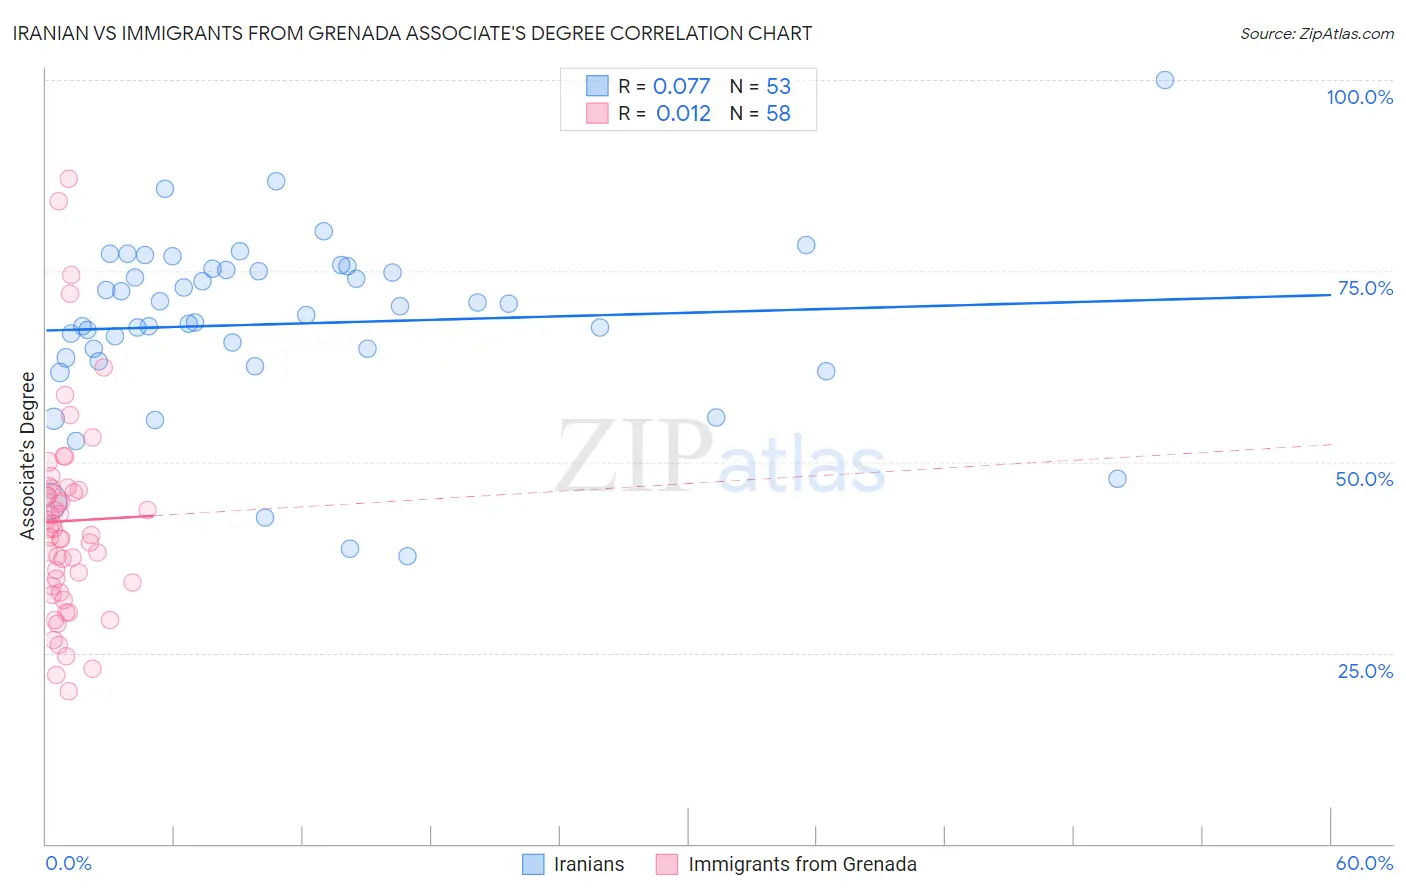
Iranian vs Immigrants from Grenada Associate's Degree Correlation Chart
The statistical analysis conducted on geographies consisting of 316,879,465 people shows a slight positive correlation between the proportion of Iranians and percentage of population with at least associate's degree education in the United States with a correlation coefficient (R) of 0.077 and weighted average of 58.2%. Similarly, the statistical analysis conducted on geographies consisting of 67,201,096 people shows no correlation between the proportion of Immigrants from Grenada and percentage of population with at least associate's degree education in the United States with a correlation coefficient (R) of 0.012 and weighted average of 42.6%, a difference of 36.5%.
Associate's Degree Correlation Summary
| Measurement | Iranian | Immigrants from Grenada |
| Minimum | 37.7% | 20.0% |
| Maximum | 100.0% | 87.1% |
| Range | 62.3% | 67.1% |
| Mean | 68.1% | 42.3% |
| Median | 69.2% | 40.8% |
| Interquartile 25% (IQ1) | 63.4% | 33.8% |
| Interquartile 75% (IQ3) | 75.2% | 46.4% |
| Interquartile Range (IQR) | 11.8% | 12.7% |
| Standard Deviation (Sample) | 11.7% | 13.7% |
| Standard Deviation (Population) | 11.6% | 13.5% |
Similar Demographics by Associate's Degree
Demographics Similar to Iranians by Associate's Degree
In terms of associate's degree, the demographic groups most similar to Iranians are Immigrants from Taiwan (58.4%, a difference of 0.41%), Immigrants from India (58.5%, a difference of 0.66%), Okinawan (57.7%, a difference of 0.83%), Immigrants from Iran (57.7%, a difference of 0.89%), and Thai (57.4%, a difference of 1.3%).
| Demographics | Rating | Rank | Associate's Degree |
| Filipinos | 100.0 /100 | #1 | Exceptional 59.8% |
| Immigrants | Singapore | 100.0 /100 | #2 | Exceptional 58.9% |
| Immigrants | India | 100.0 /100 | #3 | Exceptional 58.5% |
| Immigrants | Taiwan | 100.0 /100 | #4 | Exceptional 58.4% |
| Iranians | 100.0 /100 | #5 | Exceptional 58.2% |
| Okinawans | 100.0 /100 | #6 | Exceptional 57.7% |
| Immigrants | Iran | 100.0 /100 | #7 | Exceptional 57.7% |
| Thais | 100.0 /100 | #8 | Exceptional 57.4% |
| Immigrants | Israel | 100.0 /100 | #9 | Exceptional 56.8% |
| Cypriots | 100.0 /100 | #10 | Exceptional 56.4% |
| Immigrants | Australia | 100.0 /100 | #11 | Exceptional 55.8% |
| Immigrants | South Central Asia | 100.0 /100 | #12 | Exceptional 55.7% |
| Immigrants | China | 100.0 /100 | #13 | Exceptional 55.5% |
| Immigrants | Hong Kong | 100.0 /100 | #14 | Exceptional 55.4% |
| Immigrants | Eastern Asia | 100.0 /100 | #15 | Exceptional 55.4% |
Demographics Similar to Immigrants from Grenada by Associate's Degree
In terms of associate's degree, the demographic groups most similar to Immigrants from Grenada are Cree (42.5%, a difference of 0.18%), Iroquois (42.8%, a difference of 0.51%), British West Indian (42.4%, a difference of 0.51%), Immigrants from West Indies (42.4%, a difference of 0.52%), and Guyanese (42.3%, a difference of 0.64%).
| Demographics | Rating | Rank | Associate's Degree |
| Native Hawaiians | 2.3 /100 | #232 | Tragic 43.1% |
| Tongans | 2.2 /100 | #233 | Tragic 43.0% |
| Tlingit-Haida | 2.1 /100 | #234 | Tragic 43.0% |
| Ecuadorians | 2.0 /100 | #235 | Tragic 43.0% |
| Immigrants | St. Vincent and the Grenadines | 1.9 /100 | #236 | Tragic 42.9% |
| Immigrants | Nonimmigrants | 1.9 /100 | #237 | Tragic 42.9% |
| Iroquois | 1.7 /100 | #238 | Tragic 42.8% |
| Immigrants | Grenada | 1.3 /100 | #239 | Tragic 42.6% |
| Cree | 1.2 /100 | #240 | Tragic 42.5% |
| British West Indians | 1.0 /100 | #241 | Tragic 42.4% |
| Immigrants | West Indies | 1.0 /100 | #242 | Tragic 42.4% |
| Guyanese | 1.0 /100 | #243 | Tragic 42.3% |
| Immigrants | Liberia | 0.9 /100 | #244 | Tragic 42.3% |
| Immigrants | Cambodia | 0.9 /100 | #245 | Tragic 42.3% |
| Delaware | 0.9 /100 | #246 | Tragic 42.3% |