Iranian vs Immigrants from Kuwait Associate's Degree
COMPARE
Iranian
Immigrants from Kuwait
Associate's Degree
Associate's Degree Comparison
Iranians
Immigrants from Kuwait
58.2%
ASSOCIATE'S DEGREE
100.0/ 100
METRIC RATING
5th/ 347
METRIC RANK
52.4%
ASSOCIATE'S DEGREE
99.9/ 100
METRIC RATING
47th/ 347
METRIC RANK
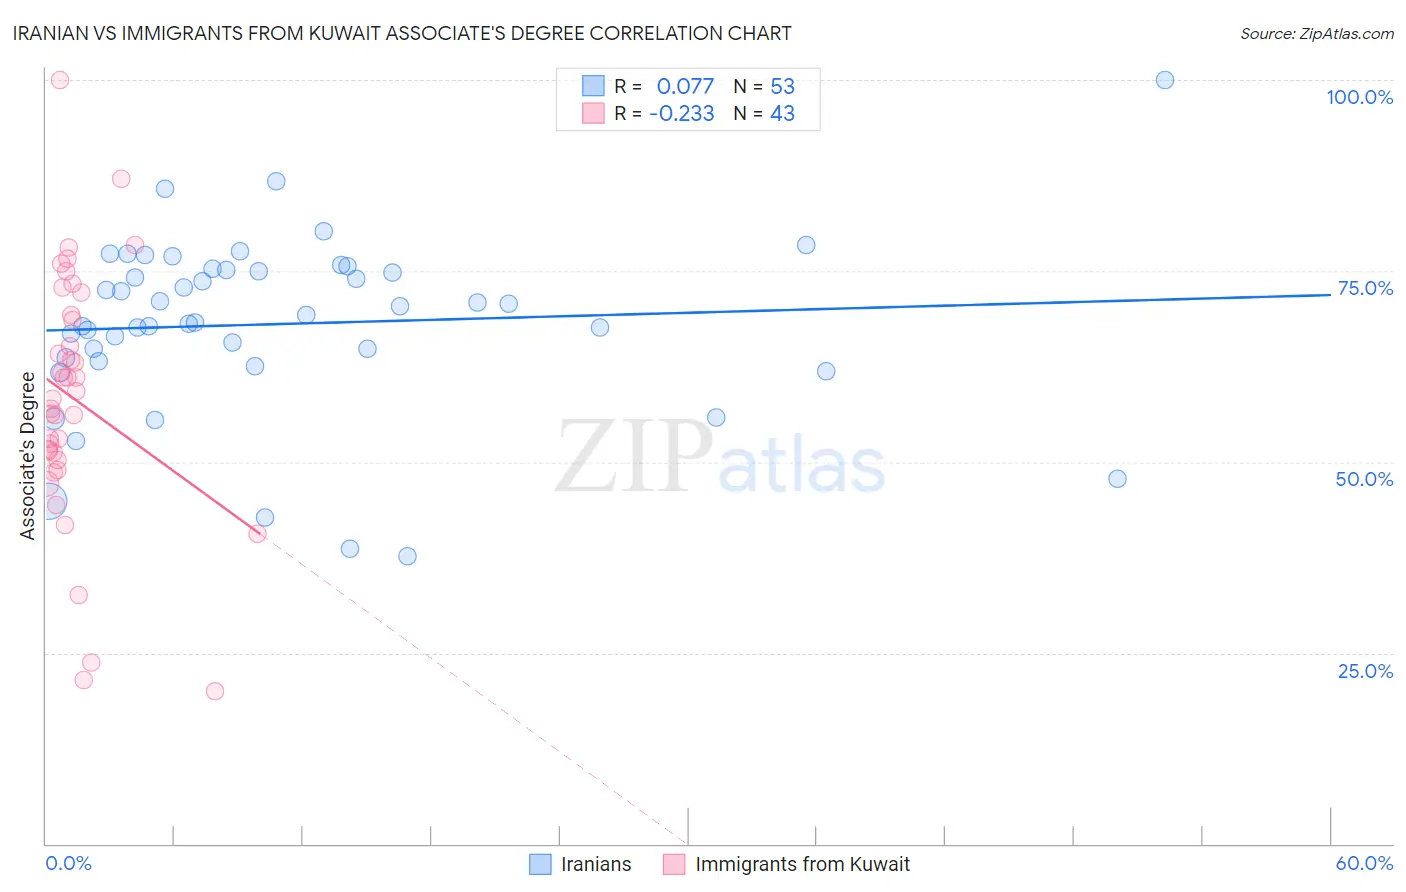
Iranian vs Immigrants from Kuwait Associate's Degree Correlation Chart
The statistical analysis conducted on geographies consisting of 316,879,465 people shows a slight positive correlation between the proportion of Iranians and percentage of population with at least associate's degree education in the United States with a correlation coefficient (R) of 0.077 and weighted average of 58.2%. Similarly, the statistical analysis conducted on geographies consisting of 136,917,085 people shows a weak negative correlation between the proportion of Immigrants from Kuwait and percentage of population with at least associate's degree education in the United States with a correlation coefficient (R) of -0.233 and weighted average of 52.4%, a difference of 11.1%.
Associate's Degree Correlation Summary
| Measurement | Iranian | Immigrants from Kuwait |
| Minimum | 37.7% | 19.9% |
| Maximum | 100.0% | 100.0% |
| Range | 62.3% | 80.1% |
| Mean | 68.1% | 58.2% |
| Median | 69.2% | 58.2% |
| Interquartile 25% (IQ1) | 63.4% | 50.2% |
| Interquartile 75% (IQ3) | 75.2% | 69.3% |
| Interquartile Range (IQR) | 11.8% | 19.1% |
| Standard Deviation (Sample) | 11.7% | 16.5% |
| Standard Deviation (Population) | 11.6% | 16.3% |
Similar Demographics by Associate's Degree
Demographics Similar to Iranians by Associate's Degree
In terms of associate's degree, the demographic groups most similar to Iranians are Immigrants from Taiwan (58.4%, a difference of 0.41%), Immigrants from India (58.5%, a difference of 0.66%), Okinawan (57.7%, a difference of 0.83%), Immigrants from Iran (57.7%, a difference of 0.89%), and Thai (57.4%, a difference of 1.3%).
| Demographics | Rating | Rank | Associate's Degree |
| Filipinos | 100.0 /100 | #1 | Exceptional 59.8% |
| Immigrants | Singapore | 100.0 /100 | #2 | Exceptional 58.9% |
| Immigrants | India | 100.0 /100 | #3 | Exceptional 58.5% |
| Immigrants | Taiwan | 100.0 /100 | #4 | Exceptional 58.4% |
| Iranians | 100.0 /100 | #5 | Exceptional 58.2% |
| Okinawans | 100.0 /100 | #6 | Exceptional 57.7% |
| Immigrants | Iran | 100.0 /100 | #7 | Exceptional 57.7% |
| Thais | 100.0 /100 | #8 | Exceptional 57.4% |
| Immigrants | Israel | 100.0 /100 | #9 | Exceptional 56.8% |
| Cypriots | 100.0 /100 | #10 | Exceptional 56.4% |
| Immigrants | Australia | 100.0 /100 | #11 | Exceptional 55.8% |
| Immigrants | South Central Asia | 100.0 /100 | #12 | Exceptional 55.7% |
| Immigrants | China | 100.0 /100 | #13 | Exceptional 55.5% |
| Immigrants | Hong Kong | 100.0 /100 | #14 | Exceptional 55.4% |
| Immigrants | Eastern Asia | 100.0 /100 | #15 | Exceptional 55.4% |
Demographics Similar to Immigrants from Kuwait by Associate's Degree
In terms of associate's degree, the demographic groups most similar to Immigrants from Kuwait are Immigrants from Bulgaria (52.4%, a difference of 0.010%), Immigrants from Lithuania (52.4%, a difference of 0.14%), Estonian (52.5%, a difference of 0.22%), Immigrants from Norway (52.2%, a difference of 0.26%), and Immigrants from South Africa (52.5%, a difference of 0.31%).
| Demographics | Rating | Rank | Associate's Degree |
| Immigrants | Latvia | 99.9 /100 | #40 | Exceptional 52.8% |
| Immigrants | Saudi Arabia | 99.9 /100 | #41 | Exceptional 52.6% |
| Immigrants | Malaysia | 99.9 /100 | #42 | Exceptional 52.5% |
| Immigrants | South Africa | 99.9 /100 | #43 | Exceptional 52.5% |
| Estonians | 99.9 /100 | #44 | Exceptional 52.5% |
| Immigrants | Lithuania | 99.9 /100 | #45 | Exceptional 52.4% |
| Immigrants | Bulgaria | 99.9 /100 | #46 | Exceptional 52.4% |
| Immigrants | Kuwait | 99.9 /100 | #47 | Exceptional 52.4% |
| Immigrants | Norway | 99.9 /100 | #48 | Exceptional 52.2% |
| Immigrants | Austria | 99.9 /100 | #49 | Exceptional 52.1% |
| Asians | 99.9 /100 | #50 | Exceptional 52.1% |
| Immigrants | Greece | 99.9 /100 | #51 | Exceptional 52.1% |
| Bolivians | 99.8 /100 | #52 | Exceptional 52.0% |
| Immigrants | Asia | 99.8 /100 | #53 | Exceptional 52.0% |
| Immigrants | Spain | 99.8 /100 | #54 | Exceptional 51.9% |