Immigrants vs Osage No Schooling Completed
COMPARE
Immigrants
Osage
No Schooling Completed
No Schooling Completed Comparison
Immigrants
Osage
2.8%
NO SCHOOLING COMPLETED
0.0/ 100
METRIC RATING
296th/ 347
METRIC RANK
1.8%
NO SCHOOLING COMPLETED
99.2/ 100
METRIC RATING
87th/ 347
METRIC RANK
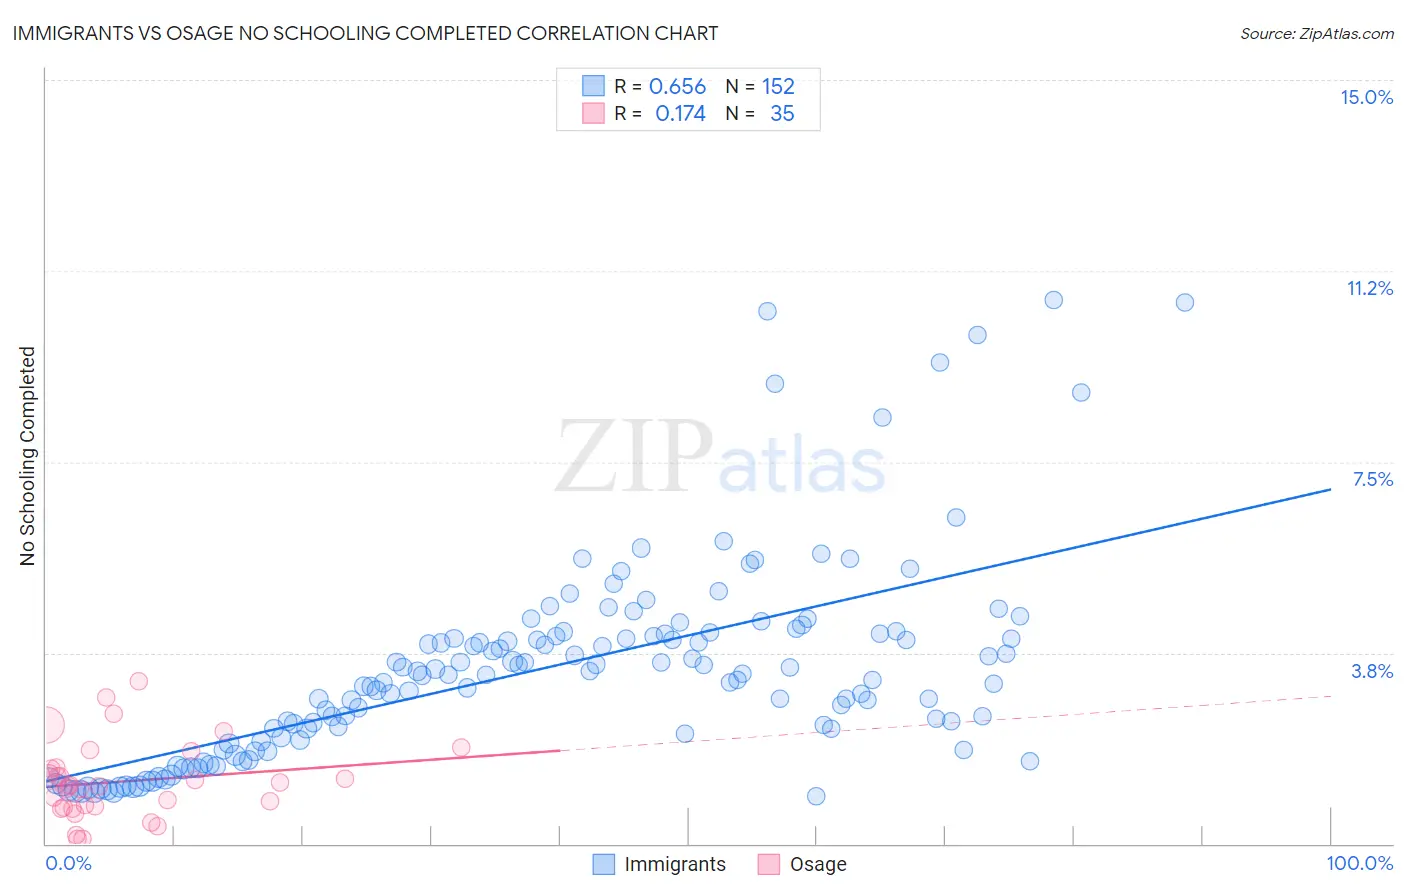
Immigrants vs Osage No Schooling Completed Correlation Chart
The statistical analysis conducted on geographies consisting of 558,837,103 people shows a significant positive correlation between the proportion of Immigrants and percentage of population with no schooling in the United States with a correlation coefficient (R) of 0.656 and weighted average of 2.8%. Similarly, the statistical analysis conducted on geographies consisting of 91,503,945 people shows a poor positive correlation between the proportion of Osage and percentage of population with no schooling in the United States with a correlation coefficient (R) of 0.174 and weighted average of 1.8%, a difference of 58.8%.
No Schooling Completed Correlation Summary
| Measurement | Immigrants | Osage |
| Minimum | 0.93% | 0.10% |
| Maximum | 10.7% | 3.2% |
| Range | 9.8% | 3.1% |
| Mean | 3.4% | 1.2% |
| Median | 3.3% | 1.1% |
| Interquartile 25% (IQ1) | 2.0% | 0.71% |
| Interquartile 75% (IQ3) | 4.1% | 1.5% |
| Interquartile Range (IQR) | 2.1% | 0.78% |
| Standard Deviation (Sample) | 2.0% | 0.75% |
| Standard Deviation (Population) | 2.0% | 0.74% |
Similar Demographics by No Schooling Completed
Demographics Similar to Immigrants by No Schooling Completed
In terms of no schooling completed, the demographic groups most similar to Immigrants are Houma (2.8%, a difference of 0.10%), Immigrants from Eritrea (2.8%, a difference of 0.62%), Malaysian (2.8%, a difference of 0.79%), Immigrants from Cuba (2.8%, a difference of 1.1%), and Immigrants from Grenada (2.8%, a difference of 1.2%).
| Demographics | Rating | Rank | No Schooling Completed |
| Immigrants | Thailand | 0.0 /100 | #289 | Tragic 2.7% |
| Immigrants | Hong Kong | 0.0 /100 | #290 | Tragic 2.7% |
| British West Indians | 0.0 /100 | #291 | Tragic 2.7% |
| Immigrants | Grenada | 0.0 /100 | #292 | Tragic 2.8% |
| Malaysians | 0.0 /100 | #293 | Tragic 2.8% |
| Immigrants | Eritrea | 0.0 /100 | #294 | Tragic 2.8% |
| Houma | 0.0 /100 | #295 | Tragic 2.8% |
| Immigrants | Immigrants | 0.0 /100 | #296 | Tragic 2.8% |
| Immigrants | Cuba | 0.0 /100 | #297 | Tragic 2.8% |
| Immigrants | Dominica | 0.0 /100 | #298 | Tragic 2.8% |
| Central American Indians | 0.0 /100 | #299 | Tragic 2.8% |
| Haitians | 0.0 /100 | #300 | Tragic 2.9% |
| Immigrants | South Eastern Asia | 0.0 /100 | #301 | Tragic 2.9% |
| Immigrants | Caribbean | 0.0 /100 | #302 | Tragic 2.9% |
| Somalis | 0.0 /100 | #303 | Tragic 2.9% |
Demographics Similar to Osage by No Schooling Completed
In terms of no schooling completed, the demographic groups most similar to Osage are Immigrants from Western Europe (1.8%, a difference of 0.040%), South African (1.8%, a difference of 0.080%), Ukrainian (1.8%, a difference of 0.32%), Immigrants from Australia (1.7%, a difference of 0.37%), and Immigrants from Denmark (1.7%, a difference of 0.41%).
| Demographics | Rating | Rank | No Schooling Completed |
| Cypriots | 99.3 /100 | #80 | Exceptional 1.7% |
| Icelanders | 99.3 /100 | #81 | Exceptional 1.7% |
| Immigrants | South Africa | 99.3 /100 | #82 | Exceptional 1.7% |
| Potawatomi | 99.3 /100 | #83 | Exceptional 1.7% |
| Immigrants | Denmark | 99.2 /100 | #84 | Exceptional 1.7% |
| Immigrants | Australia | 99.2 /100 | #85 | Exceptional 1.7% |
| Ukrainians | 99.2 /100 | #86 | Exceptional 1.8% |
| Osage | 99.2 /100 | #87 | Exceptional 1.8% |
| Immigrants | Western Europe | 99.2 /100 | #88 | Exceptional 1.8% |
| South Africans | 99.1 /100 | #89 | Exceptional 1.8% |
| Sioux | 99.0 /100 | #90 | Exceptional 1.8% |
| Immigrants | Germany | 99.0 /100 | #91 | Exceptional 1.8% |
| Romanians | 98.8 /100 | #92 | Exceptional 1.8% |
| Turks | 98.7 /100 | #93 | Exceptional 1.8% |
| Immigrants | Nonimmigrants | 98.5 /100 | #94 | Exceptional 1.8% |