Moroccan vs Osage No Schooling Completed
COMPARE
Moroccan
Osage
No Schooling Completed
No Schooling Completed Comparison
Moroccans
Osage
2.2%
NO SCHOOLING COMPLETED
13.7/ 100
METRIC RATING
202nd/ 347
METRIC RANK
1.8%
NO SCHOOLING COMPLETED
99.2/ 100
METRIC RATING
87th/ 347
METRIC RANK
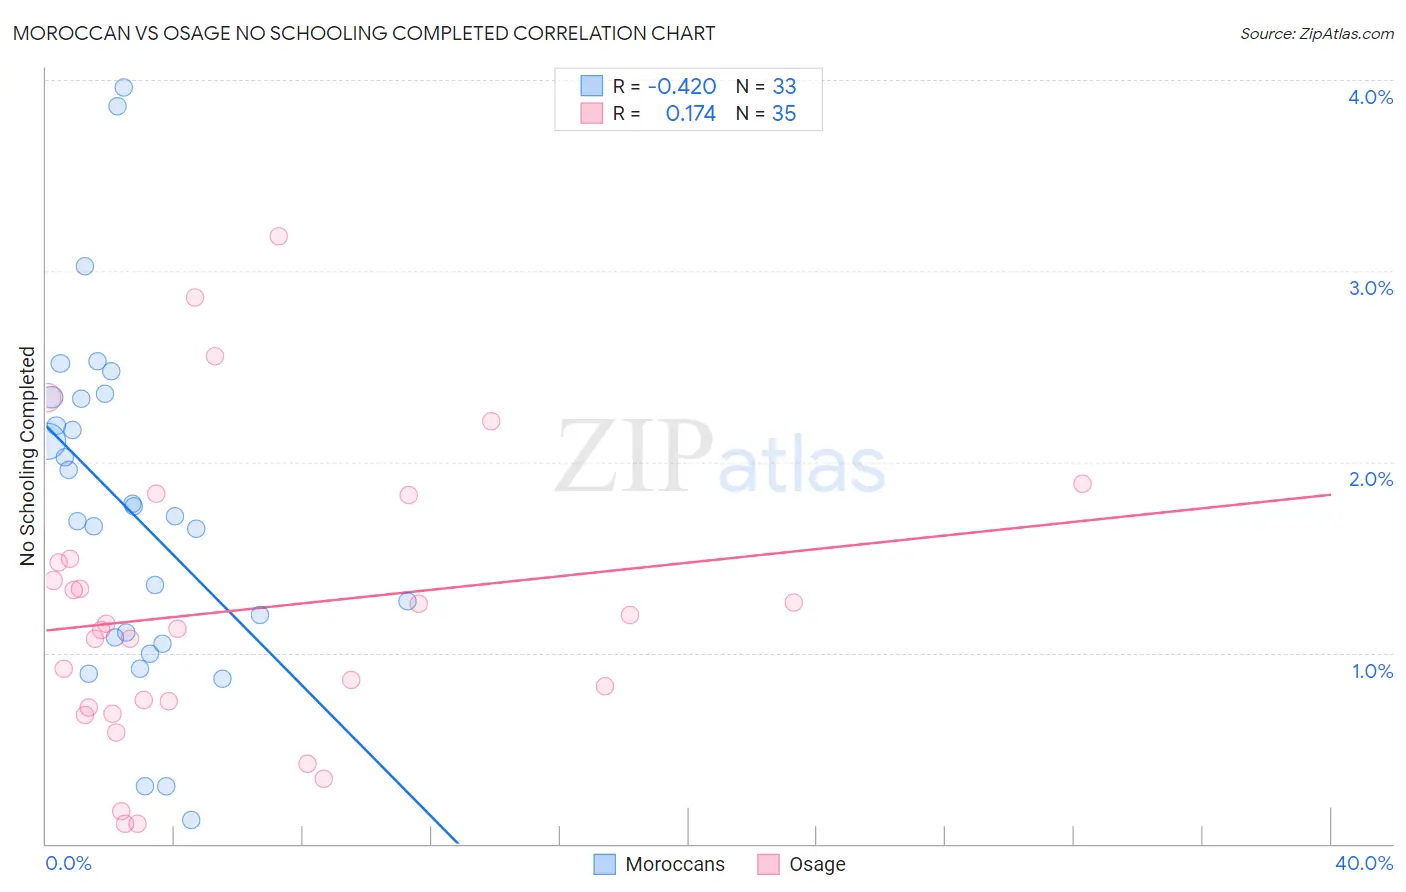
Moroccan vs Osage No Schooling Completed Correlation Chart
The statistical analysis conducted on geographies consisting of 201,160,472 people shows a moderate negative correlation between the proportion of Moroccans and percentage of population with no schooling in the United States with a correlation coefficient (R) of -0.420 and weighted average of 2.2%. Similarly, the statistical analysis conducted on geographies consisting of 91,503,945 people shows a poor positive correlation between the proportion of Osage and percentage of population with no schooling in the United States with a correlation coefficient (R) of 0.174 and weighted average of 1.8%, a difference of 26.4%.
No Schooling Completed Correlation Summary
| Measurement | Moroccan | Osage |
| Minimum | 0.12% | 0.10% |
| Maximum | 4.0% | 3.2% |
| Range | 3.8% | 3.1% |
| Mean | 1.7% | 1.2% |
| Median | 1.7% | 1.1% |
| Interquartile 25% (IQ1) | 1.1% | 0.71% |
| Interquartile 75% (IQ3) | 2.3% | 1.5% |
| Interquartile Range (IQR) | 1.3% | 0.78% |
| Standard Deviation (Sample) | 0.90% | 0.75% |
| Standard Deviation (Population) | 0.89% | 0.74% |
Similar Demographics by No Schooling Completed
Demographics Similar to Moroccans by No Schooling Completed
In terms of no schooling completed, the demographic groups most similar to Moroccans are Laotian (2.2%, a difference of 0.11%), Hopi (2.2%, a difference of 0.22%), Immigrants from Bahamas (2.2%, a difference of 0.62%), Bahamian (2.2%, a difference of 0.63%), and South American Indian (2.2%, a difference of 0.81%).
| Demographics | Rating | Rank | No Schooling Completed |
| Hawaiians | 27.0 /100 | #195 | Fair 2.2% |
| Immigrants | Ukraine | 26.1 /100 | #196 | Fair 2.2% |
| Immigrants | Southern Europe | 23.8 /100 | #197 | Fair 2.2% |
| Immigrants | Chile | 22.7 /100 | #198 | Fair 2.2% |
| Africans | 21.8 /100 | #199 | Fair 2.2% |
| Immigrants | Northern Africa | 19.5 /100 | #200 | Poor 2.2% |
| Costa Ricans | 17.1 /100 | #201 | Poor 2.2% |
| Moroccans | 13.7 /100 | #202 | Poor 2.2% |
| Laotians | 13.3 /100 | #203 | Poor 2.2% |
| Hopi | 12.9 /100 | #204 | Poor 2.2% |
| Immigrants | Bahamas | 11.6 /100 | #205 | Poor 2.2% |
| Bahamians | 11.6 /100 | #206 | Poor 2.2% |
| South American Indians | 11.0 /100 | #207 | Poor 2.2% |
| Uruguayans | 11.0 /100 | #208 | Poor 2.2% |
| Immigrants | Oceania | 10.2 /100 | #209 | Poor 2.2% |
Demographics Similar to Osage by No Schooling Completed
In terms of no schooling completed, the demographic groups most similar to Osage are Immigrants from Western Europe (1.8%, a difference of 0.040%), South African (1.8%, a difference of 0.080%), Ukrainian (1.8%, a difference of 0.32%), Immigrants from Australia (1.7%, a difference of 0.37%), and Immigrants from Denmark (1.7%, a difference of 0.41%).
| Demographics | Rating | Rank | No Schooling Completed |
| Cypriots | 99.3 /100 | #80 | Exceptional 1.7% |
| Icelanders | 99.3 /100 | #81 | Exceptional 1.7% |
| Immigrants | South Africa | 99.3 /100 | #82 | Exceptional 1.7% |
| Potawatomi | 99.3 /100 | #83 | Exceptional 1.7% |
| Immigrants | Denmark | 99.2 /100 | #84 | Exceptional 1.7% |
| Immigrants | Australia | 99.2 /100 | #85 | Exceptional 1.7% |
| Ukrainians | 99.2 /100 | #86 | Exceptional 1.8% |
| Osage | 99.2 /100 | #87 | Exceptional 1.8% |
| Immigrants | Western Europe | 99.2 /100 | #88 | Exceptional 1.8% |
| South Africans | 99.1 /100 | #89 | Exceptional 1.8% |
| Sioux | 99.0 /100 | #90 | Exceptional 1.8% |
| Immigrants | Germany | 99.0 /100 | #91 | Exceptional 1.8% |
| Romanians | 98.8 /100 | #92 | Exceptional 1.8% |
| Turks | 98.7 /100 | #93 | Exceptional 1.8% |
| Immigrants | Nonimmigrants | 98.5 /100 | #94 | Exceptional 1.8% |