Immigrants vs Immigrants from Hungary No Schooling Completed
COMPARE
Immigrants
Immigrants from Hungary
No Schooling Completed
No Schooling Completed Comparison
Immigrants
Immigrants from Hungary
2.8%
NO SCHOOLING COMPLETED
0.0/ 100
METRIC RATING
296th/ 347
METRIC RANK
1.9%
NO SCHOOLING COMPLETED
91.6/ 100
METRIC RATING
131st/ 347
METRIC RANK
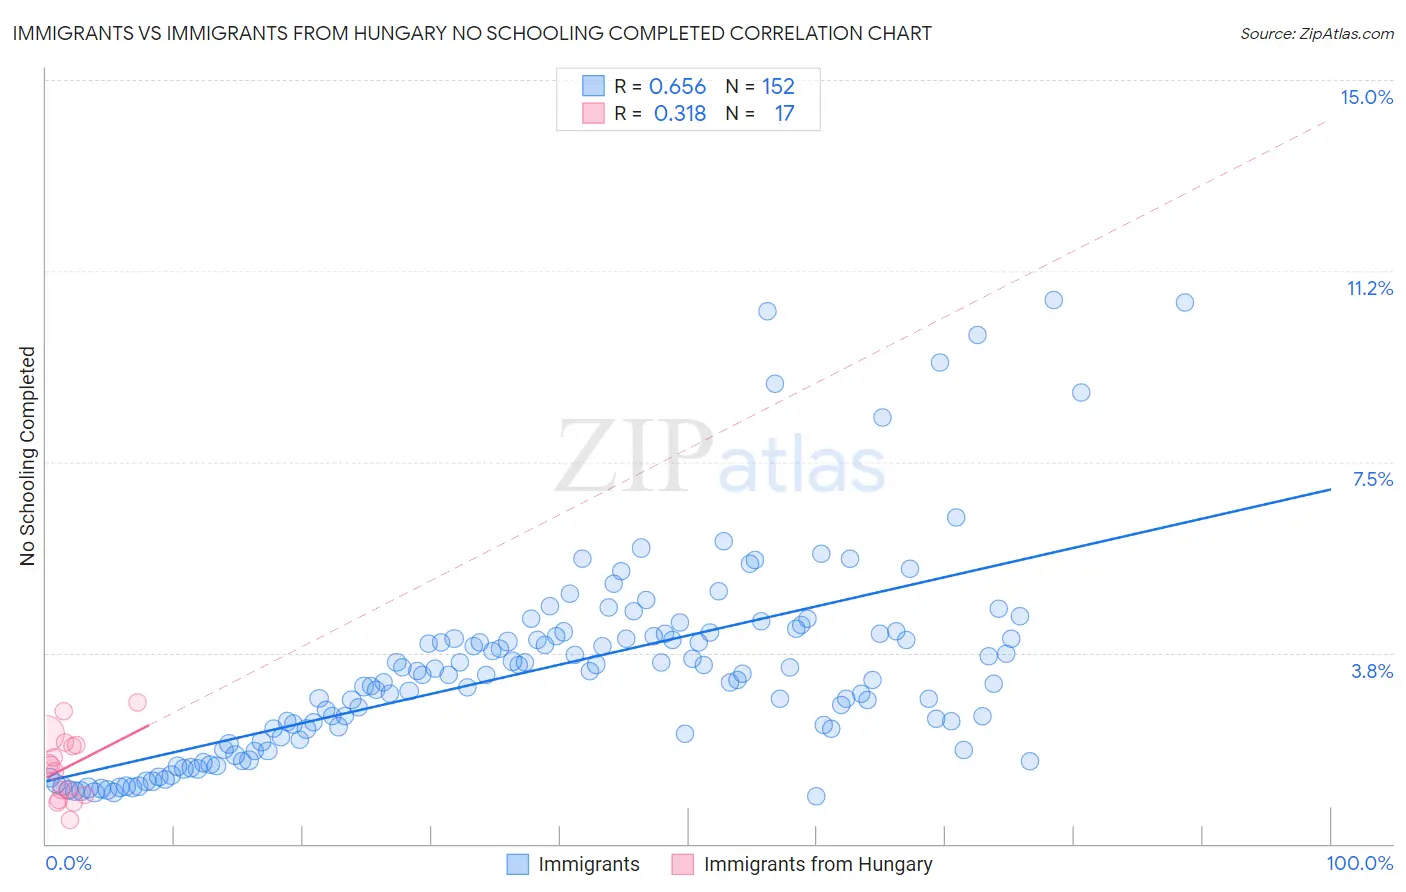
Immigrants vs Immigrants from Hungary No Schooling Completed Correlation Chart
The statistical analysis conducted on geographies consisting of 558,837,103 people shows a significant positive correlation between the proportion of Immigrants and percentage of population with no schooling in the United States with a correlation coefficient (R) of 0.656 and weighted average of 2.8%. Similarly, the statistical analysis conducted on geographies consisting of 194,617,167 people shows a mild positive correlation between the proportion of Immigrants from Hungary and percentage of population with no schooling in the United States with a correlation coefficient (R) of 0.318 and weighted average of 1.9%, a difference of 45.0%.
No Schooling Completed Correlation Summary
| Measurement | Immigrants | Immigrants from Hungary |
| Minimum | 0.93% | 0.47% |
| Maximum | 10.7% | 2.8% |
| Range | 9.8% | 2.3% |
| Mean | 3.4% | 1.5% |
| Median | 3.3% | 1.5% |
| Interquartile 25% (IQ1) | 2.0% | 0.91% |
| Interquartile 75% (IQ3) | 4.1% | 2.0% |
| Interquartile Range (IQR) | 2.1% | 1.1% |
| Standard Deviation (Sample) | 2.0% | 0.66% |
| Standard Deviation (Population) | 2.0% | 0.64% |
Similar Demographics by No Schooling Completed
Demographics Similar to Immigrants by No Schooling Completed
In terms of no schooling completed, the demographic groups most similar to Immigrants are Houma (2.8%, a difference of 0.10%), Immigrants from Eritrea (2.8%, a difference of 0.62%), Malaysian (2.8%, a difference of 0.79%), Immigrants from Cuba (2.8%, a difference of 1.1%), and Immigrants from Grenada (2.8%, a difference of 1.2%).
| Demographics | Rating | Rank | No Schooling Completed |
| Immigrants | Thailand | 0.0 /100 | #289 | Tragic 2.7% |
| Immigrants | Hong Kong | 0.0 /100 | #290 | Tragic 2.7% |
| British West Indians | 0.0 /100 | #291 | Tragic 2.7% |
| Immigrants | Grenada | 0.0 /100 | #292 | Tragic 2.8% |
| Malaysians | 0.0 /100 | #293 | Tragic 2.8% |
| Immigrants | Eritrea | 0.0 /100 | #294 | Tragic 2.8% |
| Houma | 0.0 /100 | #295 | Tragic 2.8% |
| Immigrants | Immigrants | 0.0 /100 | #296 | Tragic 2.8% |
| Immigrants | Cuba | 0.0 /100 | #297 | Tragic 2.8% |
| Immigrants | Dominica | 0.0 /100 | #298 | Tragic 2.8% |
| Central American Indians | 0.0 /100 | #299 | Tragic 2.8% |
| Haitians | 0.0 /100 | #300 | Tragic 2.9% |
| Immigrants | South Eastern Asia | 0.0 /100 | #301 | Tragic 2.9% |
| Immigrants | Caribbean | 0.0 /100 | #302 | Tragic 2.9% |
| Somalis | 0.0 /100 | #303 | Tragic 2.9% |
Demographics Similar to Immigrants from Hungary by No Schooling Completed
In terms of no schooling completed, the demographic groups most similar to Immigrants from Hungary are Palestinian (1.9%, a difference of 0.11%), Seminole (1.9%, a difference of 0.21%), Spaniard (1.9%, a difference of 0.35%), Israeli (1.9%, a difference of 0.44%), and Colville (1.9%, a difference of 0.50%).
| Demographics | Rating | Rank | No Schooling Completed |
| Cambodians | 93.8 /100 | #124 | Exceptional 1.9% |
| Immigrants | Europe | 93.7 /100 | #125 | Exceptional 1.9% |
| Immigrants | Romania | 92.6 /100 | #126 | Exceptional 1.9% |
| Israelis | 92.4 /100 | #127 | Exceptional 1.9% |
| Spaniards | 92.3 /100 | #128 | Exceptional 1.9% |
| Seminole | 92.0 /100 | #129 | Exceptional 1.9% |
| Palestinians | 91.8 /100 | #130 | Exceptional 1.9% |
| Immigrants | Hungary | 91.6 /100 | #131 | Exceptional 1.9% |
| Colville | 90.4 /100 | #132 | Exceptional 1.9% |
| Immigrants | Turkey | 90.2 /100 | #133 | Exceptional 1.9% |
| Menominee | 89.6 /100 | #134 | Excellent 1.9% |
| Hmong | 88.5 /100 | #135 | Excellent 1.9% |
| Burmese | 88.2 /100 | #136 | Excellent 1.9% |
| Filipinos | 85.5 /100 | #137 | Excellent 2.0% |
| Immigrants | Israel | 85.4 /100 | #138 | Excellent 2.0% |