Immigrants vs Immigrants from Argentina No Schooling Completed
COMPARE
Immigrants
Immigrants from Argentina
No Schooling Completed
No Schooling Completed Comparison
Immigrants
Immigrants from Argentina
2.8%
NO SCHOOLING COMPLETED
0.0/ 100
METRIC RATING
296th/ 347
METRIC RANK
2.1%
NO SCHOOLING COMPLETED
52.7/ 100
METRIC RATING
172nd/ 347
METRIC RANK
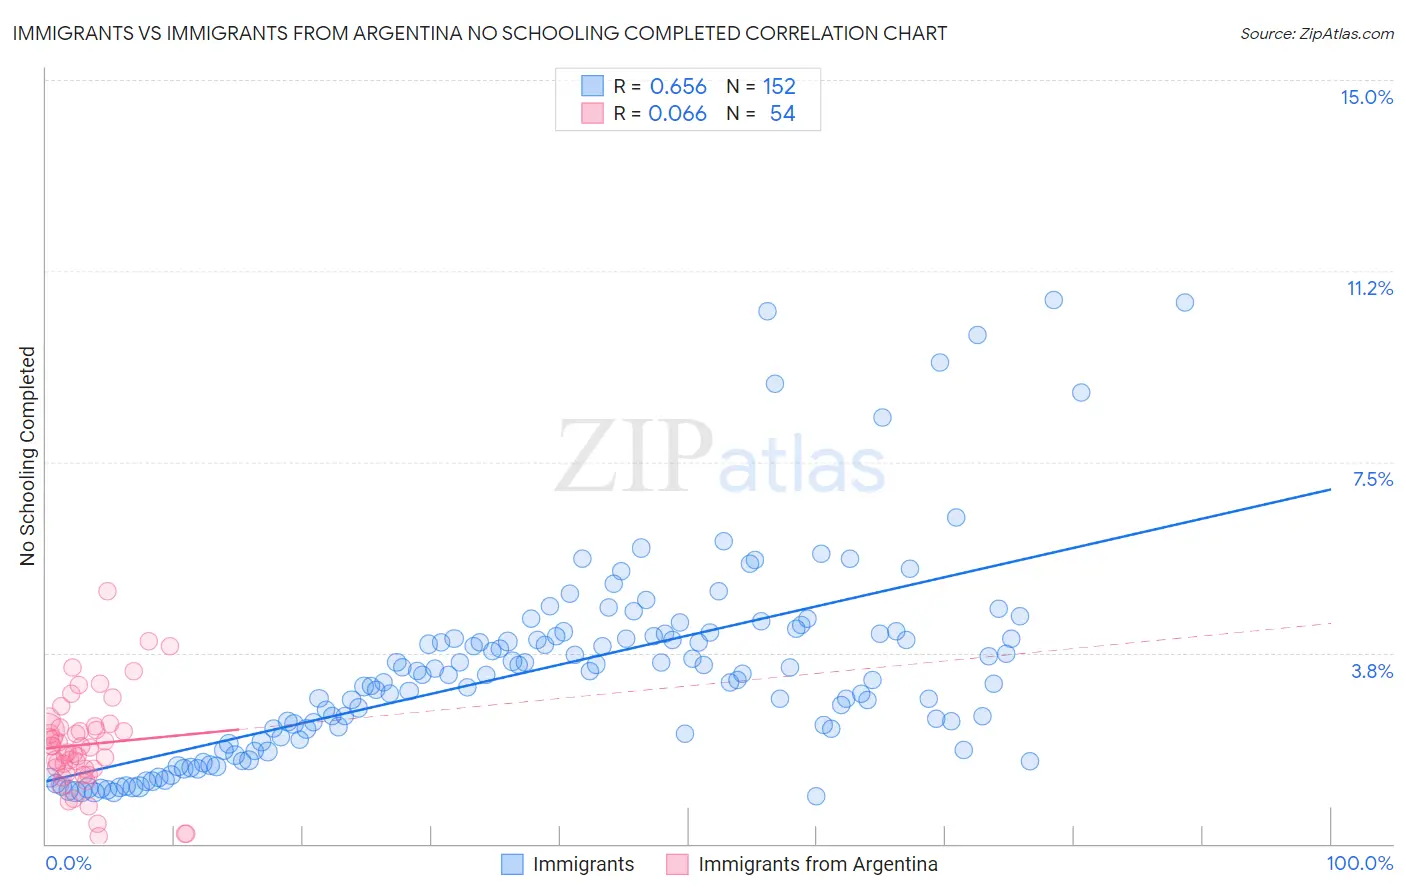
Immigrants vs Immigrants from Argentina No Schooling Completed Correlation Chart
The statistical analysis conducted on geographies consisting of 558,837,103 people shows a significant positive correlation between the proportion of Immigrants and percentage of population with no schooling in the United States with a correlation coefficient (R) of 0.656 and weighted average of 2.8%. Similarly, the statistical analysis conducted on geographies consisting of 262,849,156 people shows a slight positive correlation between the proportion of Immigrants from Argentina and percentage of population with no schooling in the United States with a correlation coefficient (R) of 0.066 and weighted average of 2.1%, a difference of 33.9%.
No Schooling Completed Correlation Summary
| Measurement | Immigrants | Immigrants from Argentina |
| Minimum | 0.93% | 0.14% |
| Maximum | 10.7% | 4.9% |
| Range | 9.8% | 4.8% |
| Mean | 3.4% | 1.9% |
| Median | 3.3% | 1.9% |
| Interquartile 25% (IQ1) | 2.0% | 1.5% |
| Interquartile 75% (IQ3) | 4.1% | 2.3% |
| Interquartile Range (IQR) | 2.1% | 0.82% |
| Standard Deviation (Sample) | 2.0% | 0.94% |
| Standard Deviation (Population) | 2.0% | 0.94% |
Similar Demographics by No Schooling Completed
Demographics Similar to Immigrants by No Schooling Completed
In terms of no schooling completed, the demographic groups most similar to Immigrants are Houma (2.8%, a difference of 0.10%), Immigrants from Eritrea (2.8%, a difference of 0.62%), Malaysian (2.8%, a difference of 0.79%), Immigrants from Cuba (2.8%, a difference of 1.1%), and Immigrants from Grenada (2.8%, a difference of 1.2%).
| Demographics | Rating | Rank | No Schooling Completed |
| Immigrants | Thailand | 0.0 /100 | #289 | Tragic 2.7% |
| Immigrants | Hong Kong | 0.0 /100 | #290 | Tragic 2.7% |
| British West Indians | 0.0 /100 | #291 | Tragic 2.7% |
| Immigrants | Grenada | 0.0 /100 | #292 | Tragic 2.8% |
| Malaysians | 0.0 /100 | #293 | Tragic 2.8% |
| Immigrants | Eritrea | 0.0 /100 | #294 | Tragic 2.8% |
| Houma | 0.0 /100 | #295 | Tragic 2.8% |
| Immigrants | Immigrants | 0.0 /100 | #296 | Tragic 2.8% |
| Immigrants | Cuba | 0.0 /100 | #297 | Tragic 2.8% |
| Immigrants | Dominica | 0.0 /100 | #298 | Tragic 2.8% |
| Central American Indians | 0.0 /100 | #299 | Tragic 2.8% |
| Haitians | 0.0 /100 | #300 | Tragic 2.9% |
| Immigrants | South Eastern Asia | 0.0 /100 | #301 | Tragic 2.9% |
| Immigrants | Caribbean | 0.0 /100 | #302 | Tragic 2.9% |
| Somalis | 0.0 /100 | #303 | Tragic 2.9% |
Demographics Similar to Immigrants from Argentina by No Schooling Completed
In terms of no schooling completed, the demographic groups most similar to Immigrants from Argentina are Immigrants from Belarus (2.1%, a difference of 0.13%), Immigrants from Poland (2.1%, a difference of 0.33%), Immigrants from Micronesia (2.1%, a difference of 0.37%), Argentinean (2.1%, a difference of 0.45%), and Apache (2.1%, a difference of 0.53%).
| Demographics | Rating | Rank | No Schooling Completed |
| Brazilians | 60.2 /100 | #165 | Good 2.1% |
| Dutch West Indians | 59.9 /100 | #166 | Average 2.1% |
| Egyptians | 59.2 /100 | #167 | Average 2.1% |
| Cheyenne | 58.6 /100 | #168 | Average 2.1% |
| Apache | 56.7 /100 | #169 | Average 2.1% |
| Argentineans | 56.0 /100 | #170 | Average 2.1% |
| Immigrants | Poland | 55.2 /100 | #171 | Average 2.1% |
| Immigrants | Argentina | 52.7 /100 | #172 | Average 2.1% |
| Immigrants | Belarus | 51.8 /100 | #173 | Average 2.1% |
| Immigrants | Micronesia | 50.0 /100 | #174 | Average 2.1% |
| Arabs | 46.4 /100 | #175 | Average 2.1% |
| Panamanians | 45.2 /100 | #176 | Average 2.1% |
| Arapaho | 45.0 /100 | #177 | Average 2.1% |
| Pakistanis | 44.7 /100 | #178 | Average 2.1% |
| Immigrants | Kazakhstan | 44.3 /100 | #179 | Average 2.1% |