Immigrants vs Australian No Schooling Completed
COMPARE
Immigrants
Australian
No Schooling Completed
No Schooling Completed Comparison
Immigrants
Australians
2.8%
NO SCHOOLING COMPLETED
0.0/ 100
METRIC RATING
296th/ 347
METRIC RANK
1.6%
NO SCHOOLING COMPLETED
99.9/ 100
METRIC RATING
43rd/ 347
METRIC RANK
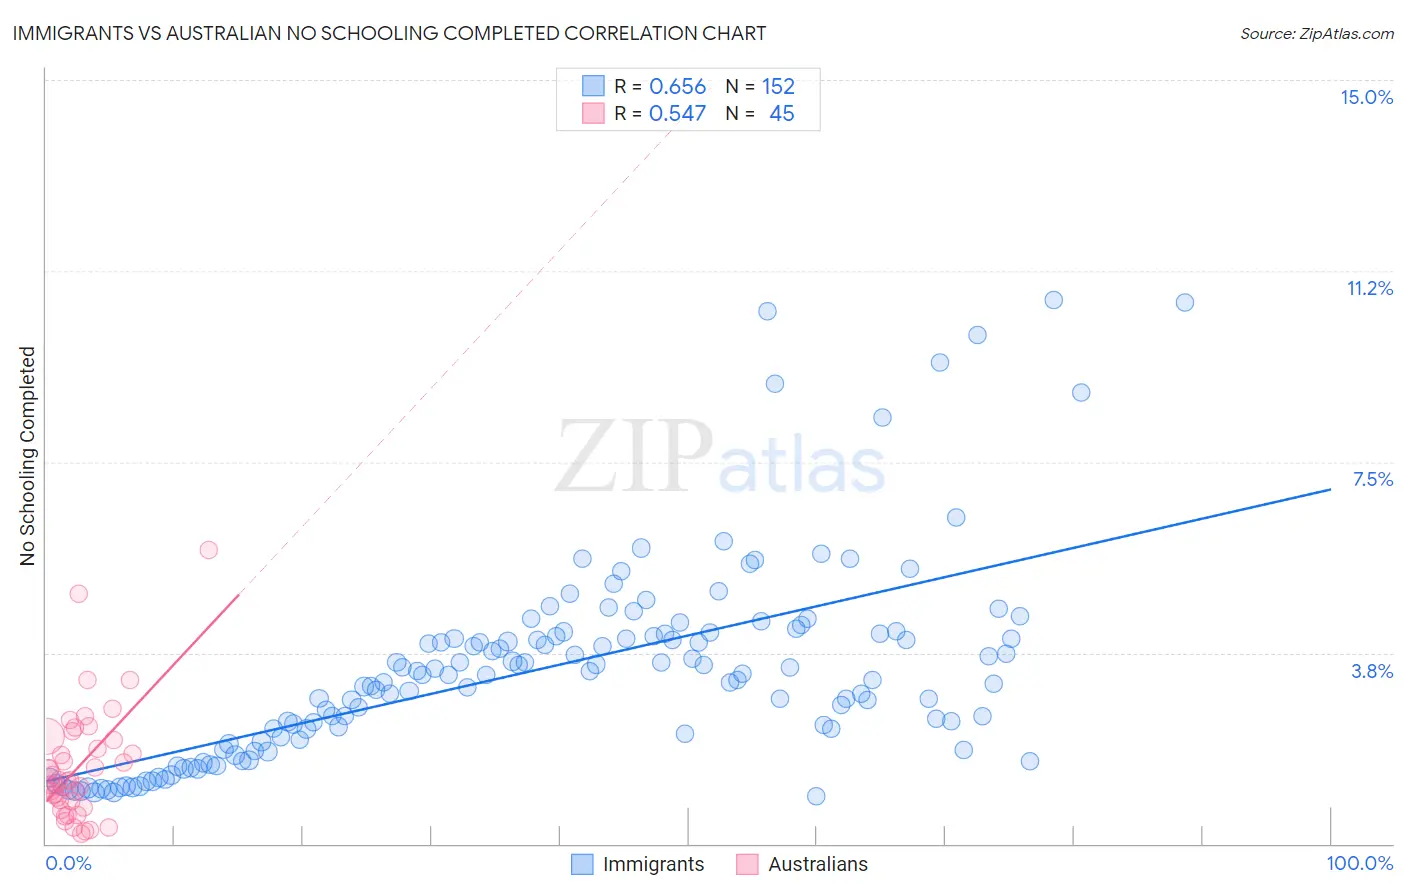
Immigrants vs Australian No Schooling Completed Correlation Chart
The statistical analysis conducted on geographies consisting of 558,837,103 people shows a significant positive correlation between the proportion of Immigrants and percentage of population with no schooling in the United States with a correlation coefficient (R) of 0.656 and weighted average of 2.8%. Similarly, the statistical analysis conducted on geographies consisting of 222,453,601 people shows a substantial positive correlation between the proportion of Australians and percentage of population with no schooling in the United States with a correlation coefficient (R) of 0.547 and weighted average of 1.6%, a difference of 72.4%.
No Schooling Completed Correlation Summary
| Measurement | Immigrants | Australian |
| Minimum | 0.93% | 0.20% |
| Maximum | 10.7% | 5.8% |
| Range | 9.8% | 5.6% |
| Mean | 3.4% | 1.5% |
| Median | 3.3% | 1.2% |
| Interquartile 25% (IQ1) | 2.0% | 0.77% |
| Interquartile 75% (IQ3) | 4.1% | 2.1% |
| Interquartile Range (IQR) | 2.1% | 1.3% |
| Standard Deviation (Sample) | 2.0% | 1.1% |
| Standard Deviation (Population) | 2.0% | 1.1% |
Similar Demographics by No Schooling Completed
Demographics Similar to Immigrants by No Schooling Completed
In terms of no schooling completed, the demographic groups most similar to Immigrants are Houma (2.8%, a difference of 0.10%), Immigrants from Eritrea (2.8%, a difference of 0.62%), Malaysian (2.8%, a difference of 0.79%), Immigrants from Cuba (2.8%, a difference of 1.1%), and Immigrants from Grenada (2.8%, a difference of 1.2%).
| Demographics | Rating | Rank | No Schooling Completed |
| Immigrants | Thailand | 0.0 /100 | #289 | Tragic 2.7% |
| Immigrants | Hong Kong | 0.0 /100 | #290 | Tragic 2.7% |
| British West Indians | 0.0 /100 | #291 | Tragic 2.7% |
| Immigrants | Grenada | 0.0 /100 | #292 | Tragic 2.8% |
| Malaysians | 0.0 /100 | #293 | Tragic 2.8% |
| Immigrants | Eritrea | 0.0 /100 | #294 | Tragic 2.8% |
| Houma | 0.0 /100 | #295 | Tragic 2.8% |
| Immigrants | Immigrants | 0.0 /100 | #296 | Tragic 2.8% |
| Immigrants | Cuba | 0.0 /100 | #297 | Tragic 2.8% |
| Immigrants | Dominica | 0.0 /100 | #298 | Tragic 2.8% |
| Central American Indians | 0.0 /100 | #299 | Tragic 2.8% |
| Haitians | 0.0 /100 | #300 | Tragic 2.9% |
| Immigrants | South Eastern Asia | 0.0 /100 | #301 | Tragic 2.9% |
| Immigrants | Caribbean | 0.0 /100 | #302 | Tragic 2.9% |
| Somalis | 0.0 /100 | #303 | Tragic 2.9% |
Demographics Similar to Australians by No Schooling Completed
In terms of no schooling completed, the demographic groups most similar to Australians are Bulgarian (1.6%, a difference of 0.12%), Estonian (1.6%, a difference of 0.19%), Czechoslovakian (1.6%, a difference of 0.23%), Maltese (1.6%, a difference of 0.32%), and Ottawa (1.6%, a difference of 0.47%).
| Demographics | Rating | Rank | No Schooling Completed |
| Aleuts | 99.9 /100 | #36 | Exceptional 1.6% |
| Belgians | 99.9 /100 | #37 | Exceptional 1.6% |
| Northern Europeans | 99.9 /100 | #38 | Exceptional 1.6% |
| Native Hawaiians | 99.9 /100 | #39 | Exceptional 1.6% |
| Luxembourgers | 99.9 /100 | #40 | Exceptional 1.6% |
| Hungarians | 99.9 /100 | #41 | Exceptional 1.6% |
| Bulgarians | 99.9 /100 | #42 | Exceptional 1.6% |
| Australians | 99.9 /100 | #43 | Exceptional 1.6% |
| Estonians | 99.9 /100 | #44 | Exceptional 1.6% |
| Czechoslovakians | 99.9 /100 | #45 | Exceptional 1.6% |
| Maltese | 99.9 /100 | #46 | Exceptional 1.6% |
| Ottawa | 99.9 /100 | #47 | Exceptional 1.6% |
| Immigrants | Scotland | 99.9 /100 | #48 | Exceptional 1.6% |
| Whites/Caucasians | 99.9 /100 | #49 | Exceptional 1.6% |
| Celtics | 99.9 /100 | #50 | Exceptional 1.6% |