Taiwanese vs Osage No Schooling Completed
COMPARE
Taiwanese
Osage
No Schooling Completed
No Schooling Completed Comparison
Taiwanese
Osage
2.5%
NO SCHOOLING COMPLETED
0.3/ 100
METRIC RATING
268th/ 347
METRIC RANK
1.8%
NO SCHOOLING COMPLETED
99.2/ 100
METRIC RATING
87th/ 347
METRIC RANK
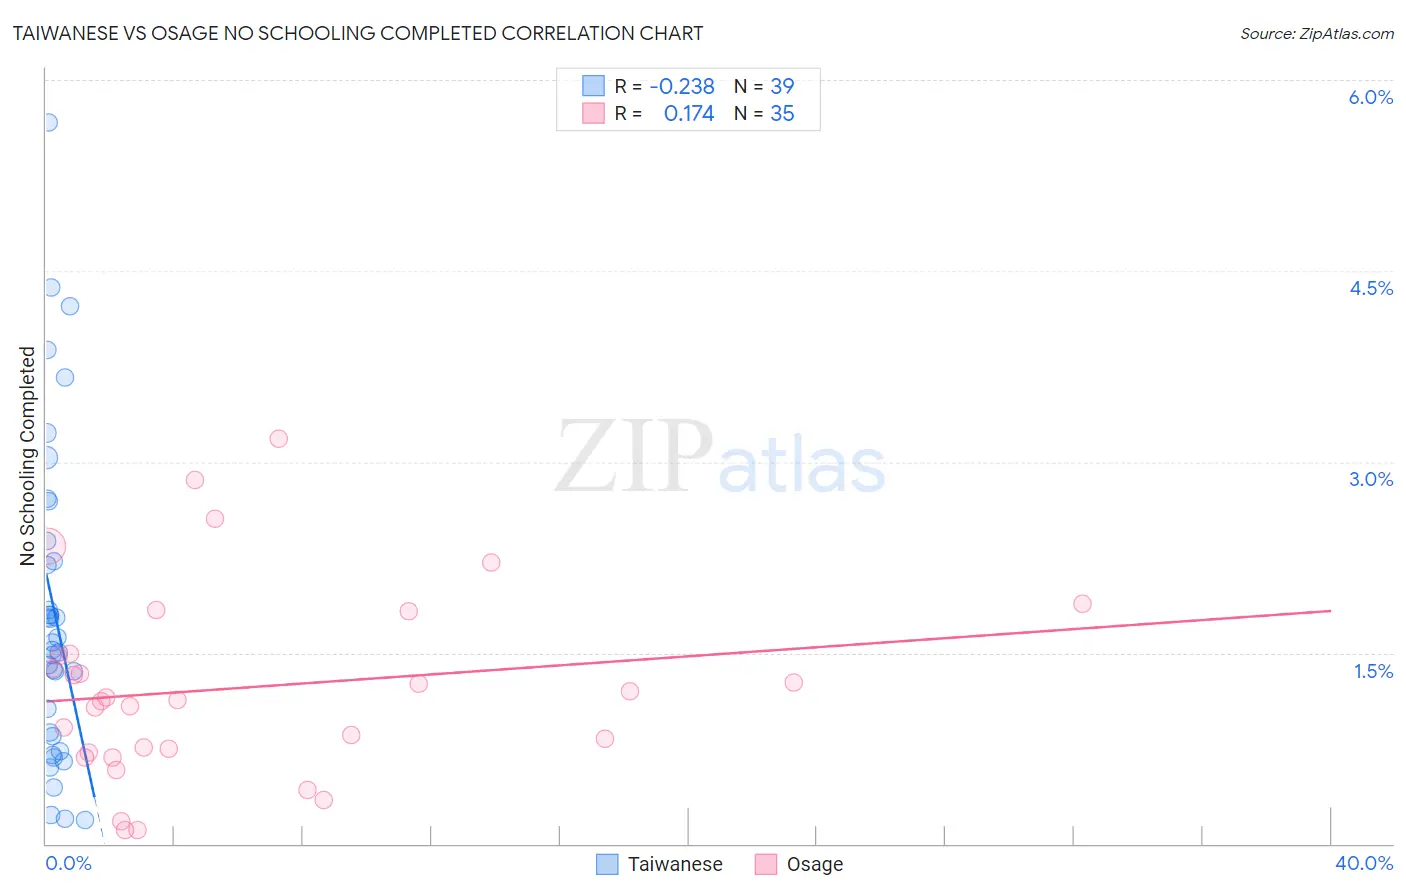
Taiwanese vs Osage No Schooling Completed Correlation Chart
The statistical analysis conducted on geographies consisting of 31,647,627 people shows a weak negative correlation between the proportion of Taiwanese and percentage of population with no schooling in the United States with a correlation coefficient (R) of -0.238 and weighted average of 2.5%. Similarly, the statistical analysis conducted on geographies consisting of 91,503,945 people shows a poor positive correlation between the proportion of Osage and percentage of population with no schooling in the United States with a correlation coefficient (R) of 0.174 and weighted average of 1.8%, a difference of 41.9%.
No Schooling Completed Correlation Summary
| Measurement | Taiwanese | Osage |
| Minimum | 0.18% | 0.10% |
| Maximum | 5.7% | 3.2% |
| Range | 5.5% | 3.1% |
| Mean | 1.8% | 1.2% |
| Median | 1.6% | 1.1% |
| Interquartile 25% (IQ1) | 0.84% | 0.71% |
| Interquartile 75% (IQ3) | 2.4% | 1.5% |
| Interquartile Range (IQR) | 1.5% | 0.78% |
| Standard Deviation (Sample) | 1.3% | 0.75% |
| Standard Deviation (Population) | 1.2% | 0.74% |
Similar Demographics by No Schooling Completed
Demographics Similar to Taiwanese by No Schooling Completed
In terms of no schooling completed, the demographic groups most similar to Taiwanese are Yuman (2.5%, a difference of 0.26%), Fijian (2.5%, a difference of 0.44%), West Indian (2.5%, a difference of 0.51%), Indian (Asian) (2.5%, a difference of 0.70%), and Immigrants from Liberia (2.5%, a difference of 0.83%).
| Demographics | Rating | Rank | No Schooling Completed |
| Armenians | 0.5 /100 | #261 | Tragic 2.5% |
| Immigrants | Sierra Leone | 0.5 /100 | #262 | Tragic 2.5% |
| Immigrants | Liberia | 0.4 /100 | #263 | Tragic 2.5% |
| Indians (Asian) | 0.4 /100 | #264 | Tragic 2.5% |
| West Indians | 0.4 /100 | #265 | Tragic 2.5% |
| Fijians | 0.4 /100 | #266 | Tragic 2.5% |
| Yuman | 0.4 /100 | #267 | Tragic 2.5% |
| Taiwanese | 0.3 /100 | #268 | Tragic 2.5% |
| Immigrants | Nigeria | 0.2 /100 | #269 | Tragic 2.5% |
| Immigrants | Peru | 0.2 /100 | #270 | Tragic 2.5% |
| Cubans | 0.2 /100 | #271 | Tragic 2.5% |
| Immigrants | Bolivia | 0.2 /100 | #272 | Tragic 2.5% |
| Immigrants | Cameroon | 0.1 /100 | #273 | Tragic 2.5% |
| Ghanaians | 0.1 /100 | #274 | Tragic 2.6% |
| Immigrants | China | 0.1 /100 | #275 | Tragic 2.6% |
Demographics Similar to Osage by No Schooling Completed
In terms of no schooling completed, the demographic groups most similar to Osage are Immigrants from Western Europe (1.8%, a difference of 0.040%), South African (1.8%, a difference of 0.080%), Ukrainian (1.8%, a difference of 0.32%), Immigrants from Australia (1.7%, a difference of 0.37%), and Immigrants from Denmark (1.7%, a difference of 0.41%).
| Demographics | Rating | Rank | No Schooling Completed |
| Cypriots | 99.3 /100 | #80 | Exceptional 1.7% |
| Icelanders | 99.3 /100 | #81 | Exceptional 1.7% |
| Immigrants | South Africa | 99.3 /100 | #82 | Exceptional 1.7% |
| Potawatomi | 99.3 /100 | #83 | Exceptional 1.7% |
| Immigrants | Denmark | 99.2 /100 | #84 | Exceptional 1.7% |
| Immigrants | Australia | 99.2 /100 | #85 | Exceptional 1.7% |
| Ukrainians | 99.2 /100 | #86 | Exceptional 1.8% |
| Osage | 99.2 /100 | #87 | Exceptional 1.8% |
| Immigrants | Western Europe | 99.2 /100 | #88 | Exceptional 1.8% |
| South Africans | 99.1 /100 | #89 | Exceptional 1.8% |
| Sioux | 99.0 /100 | #90 | Exceptional 1.8% |
| Immigrants | Germany | 99.0 /100 | #91 | Exceptional 1.8% |
| Romanians | 98.8 /100 | #92 | Exceptional 1.8% |
| Turks | 98.7 /100 | #93 | Exceptional 1.8% |
| Immigrants | Nonimmigrants | 98.5 /100 | #94 | Exceptional 1.8% |