Immigrants vs Immigrants from Iraq No Schooling Completed
COMPARE
Immigrants
Immigrants from Iraq
No Schooling Completed
No Schooling Completed Comparison
Immigrants
Immigrants from Iraq
2.8%
NO SCHOOLING COMPLETED
0.0/ 100
METRIC RATING
296th/ 347
METRIC RANK
2.4%
NO SCHOOLING COMPLETED
1.3/ 100
METRIC RATING
247th/ 347
METRIC RANK
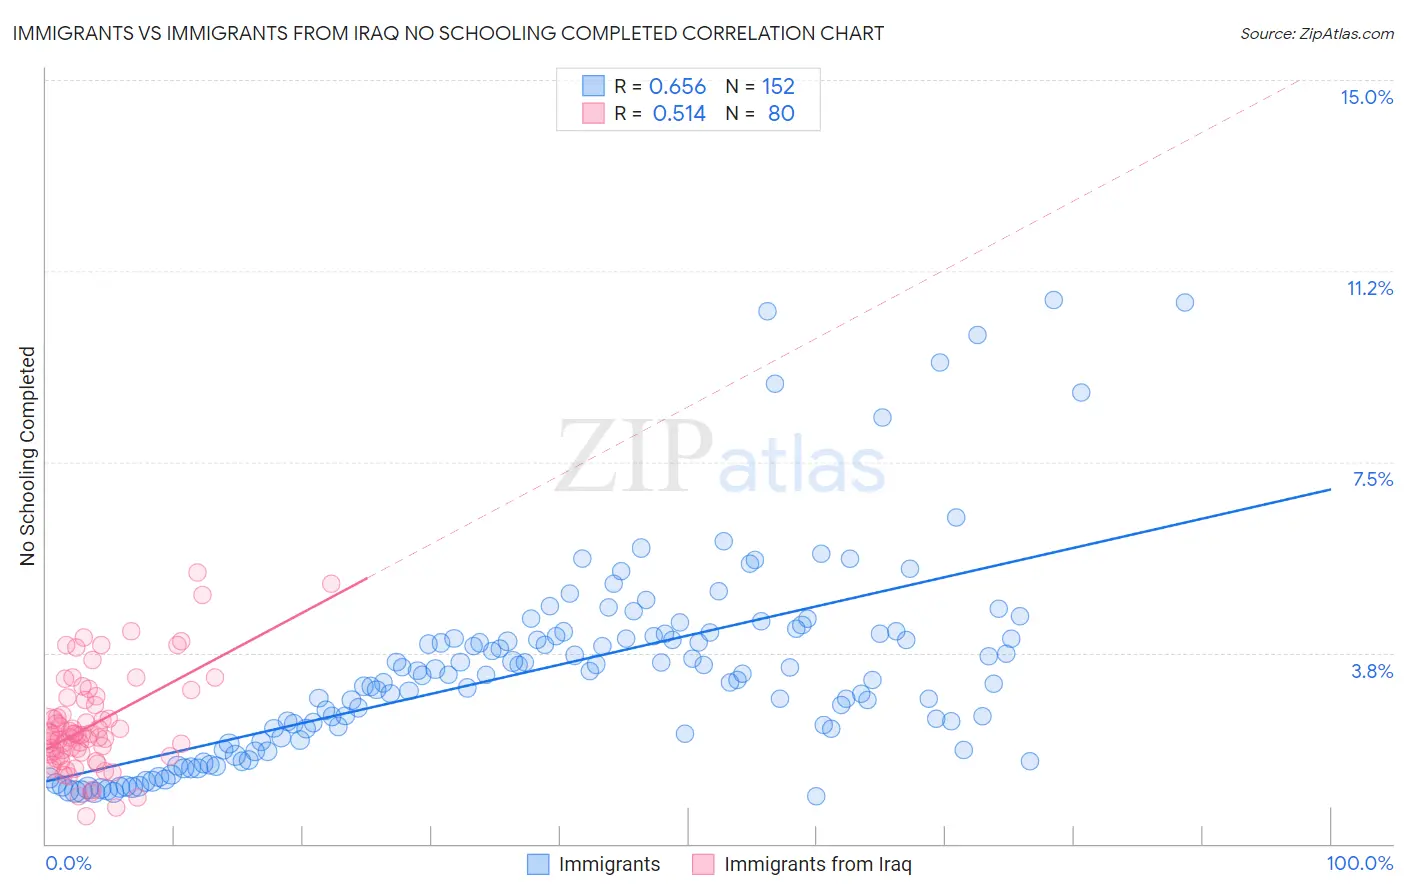
Immigrants vs Immigrants from Iraq No Schooling Completed Correlation Chart
The statistical analysis conducted on geographies consisting of 558,837,103 people shows a significant positive correlation between the proportion of Immigrants and percentage of population with no schooling in the United States with a correlation coefficient (R) of 0.656 and weighted average of 2.8%. Similarly, the statistical analysis conducted on geographies consisting of 194,285,725 people shows a substantial positive correlation between the proportion of Immigrants from Iraq and percentage of population with no schooling in the United States with a correlation coefficient (R) of 0.514 and weighted average of 2.4%, a difference of 16.6%.
No Schooling Completed Correlation Summary
| Measurement | Immigrants | Immigrants from Iraq |
| Minimum | 0.93% | 0.53% |
| Maximum | 10.7% | 5.3% |
| Range | 9.8% | 4.8% |
| Mean | 3.4% | 2.3% |
| Median | 3.3% | 2.1% |
| Interquartile 25% (IQ1) | 2.0% | 1.7% |
| Interquartile 75% (IQ3) | 4.1% | 2.8% |
| Interquartile Range (IQR) | 2.1% | 1.1% |
| Standard Deviation (Sample) | 2.0% | 0.98% |
| Standard Deviation (Population) | 2.0% | 0.97% |
Similar Demographics by No Schooling Completed
Demographics Similar to Immigrants by No Schooling Completed
In terms of no schooling completed, the demographic groups most similar to Immigrants are Houma (2.8%, a difference of 0.10%), Immigrants from Eritrea (2.8%, a difference of 0.62%), Malaysian (2.8%, a difference of 0.79%), Immigrants from Cuba (2.8%, a difference of 1.1%), and Immigrants from Grenada (2.8%, a difference of 1.2%).
| Demographics | Rating | Rank | No Schooling Completed |
| Immigrants | Thailand | 0.0 /100 | #289 | Tragic 2.7% |
| Immigrants | Hong Kong | 0.0 /100 | #290 | Tragic 2.7% |
| British West Indians | 0.0 /100 | #291 | Tragic 2.7% |
| Immigrants | Grenada | 0.0 /100 | #292 | Tragic 2.8% |
| Malaysians | 0.0 /100 | #293 | Tragic 2.8% |
| Immigrants | Eritrea | 0.0 /100 | #294 | Tragic 2.8% |
| Houma | 0.0 /100 | #295 | Tragic 2.8% |
| Immigrants | Immigrants | 0.0 /100 | #296 | Tragic 2.8% |
| Immigrants | Cuba | 0.0 /100 | #297 | Tragic 2.8% |
| Immigrants | Dominica | 0.0 /100 | #298 | Tragic 2.8% |
| Central American Indians | 0.0 /100 | #299 | Tragic 2.8% |
| Haitians | 0.0 /100 | #300 | Tragic 2.9% |
| Immigrants | South Eastern Asia | 0.0 /100 | #301 | Tragic 2.9% |
| Immigrants | Caribbean | 0.0 /100 | #302 | Tragic 2.9% |
| Somalis | 0.0 /100 | #303 | Tragic 2.9% |
Demographics Similar to Immigrants from Iraq by No Schooling Completed
In terms of no schooling completed, the demographic groups most similar to Immigrants from Iraq are Immigrants from Congo (2.4%, a difference of 0.11%), Peruvian (2.4%, a difference of 0.16%), Bolivian (2.4%, a difference of 0.16%), South American (2.4%, a difference of 0.27%), and Asian (2.4%, a difference of 0.27%).
| Demographics | Rating | Rank | No Schooling Completed |
| Immigrants | Senegal | 1.7 /100 | #240 | Tragic 2.4% |
| Koreans | 1.7 /100 | #241 | Tragic 2.4% |
| Immigrants | Indonesia | 1.5 /100 | #242 | Tragic 2.4% |
| South Americans | 1.5 /100 | #243 | Tragic 2.4% |
| Peruvians | 1.4 /100 | #244 | Tragic 2.4% |
| Bolivians | 1.4 /100 | #245 | Tragic 2.4% |
| Immigrants | Congo | 1.4 /100 | #246 | Tragic 2.4% |
| Immigrants | Iraq | 1.3 /100 | #247 | Tragic 2.4% |
| Asians | 1.2 /100 | #248 | Tragic 2.4% |
| Jamaicans | 1.2 /100 | #249 | Tragic 2.4% |
| Immigrants | Middle Africa | 1.1 /100 | #250 | Tragic 2.4% |
| Immigrants | Africa | 1.1 /100 | #251 | Tragic 2.4% |
| Immigrants | Colombia | 1.0 /100 | #252 | Tragic 2.4% |
| Immigrants | Asia | 0.9 /100 | #253 | Tragic 2.4% |
| Immigrants | Eastern Africa | 0.9 /100 | #254 | Tragic 2.4% |