Immigrants vs Immigrants from Croatia No Schooling Completed
COMPARE
Immigrants
Immigrants from Croatia
No Schooling Completed
No Schooling Completed Comparison
Immigrants
Immigrants from Croatia
2.8%
NO SCHOOLING COMPLETED
0.0/ 100
METRIC RATING
296th/ 347
METRIC RANK
1.9%
NO SCHOOLING COMPLETED
94.5/ 100
METRIC RATING
121st/ 347
METRIC RANK
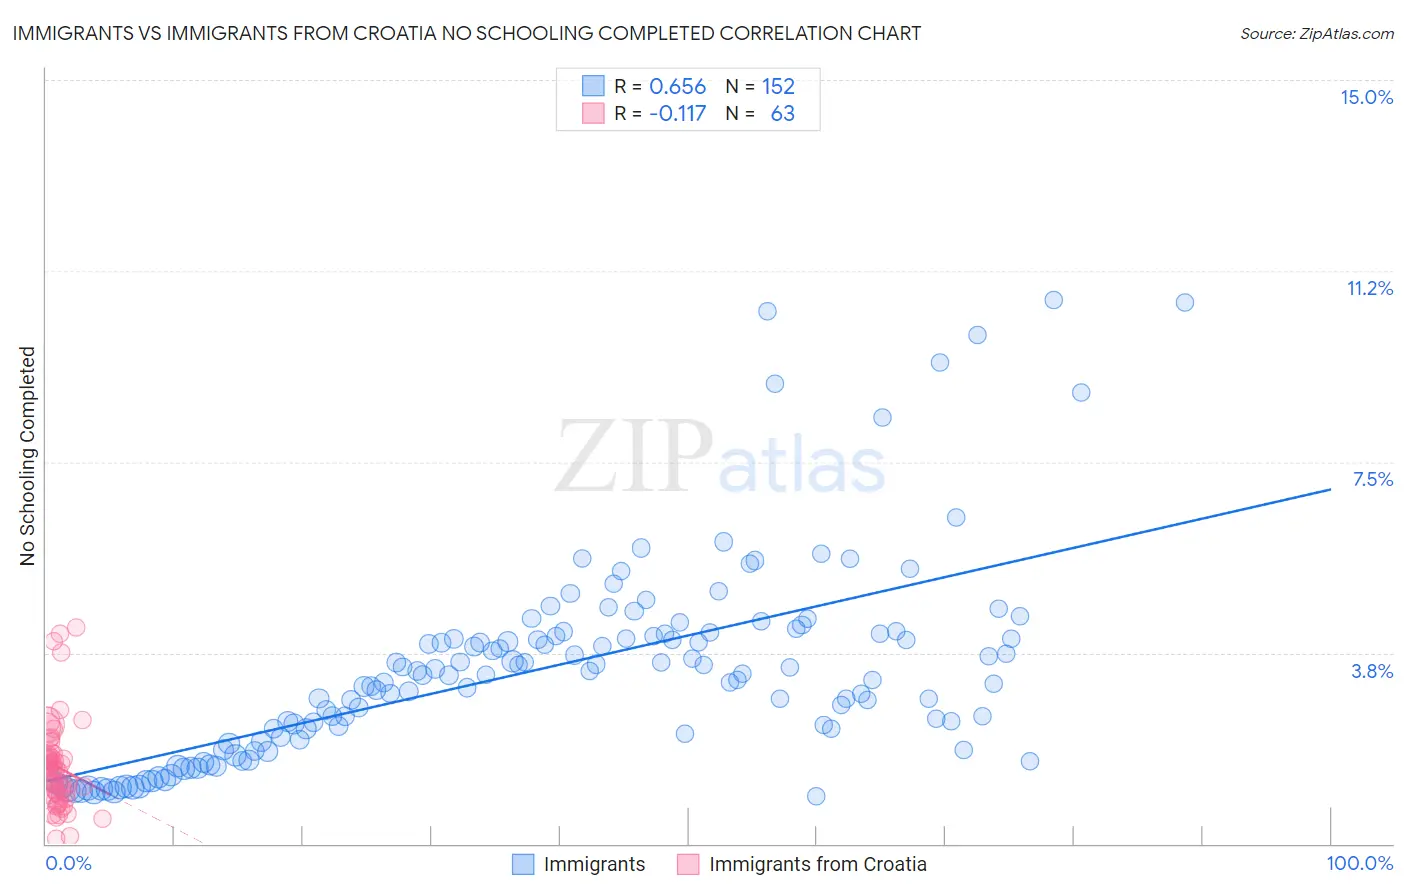
Immigrants vs Immigrants from Croatia No Schooling Completed Correlation Chart
The statistical analysis conducted on geographies consisting of 558,837,103 people shows a significant positive correlation between the proportion of Immigrants and percentage of population with no schooling in the United States with a correlation coefficient (R) of 0.656 and weighted average of 2.8%. Similarly, the statistical analysis conducted on geographies consisting of 132,073,413 people shows a poor negative correlation between the proportion of Immigrants from Croatia and percentage of population with no schooling in the United States with a correlation coefficient (R) of -0.117 and weighted average of 1.9%, a difference of 47.4%.
No Schooling Completed Correlation Summary
| Measurement | Immigrants | Immigrants from Croatia |
| Minimum | 0.93% | 0.11% |
| Maximum | 10.7% | 4.2% |
| Range | 9.8% | 4.1% |
| Mean | 3.4% | 1.5% |
| Median | 3.3% | 1.4% |
| Interquartile 25% (IQ1) | 2.0% | 0.97% |
| Interquartile 75% (IQ3) | 4.1% | 1.7% |
| Interquartile Range (IQR) | 2.1% | 0.77% |
| Standard Deviation (Sample) | 2.0% | 0.87% |
| Standard Deviation (Population) | 2.0% | 0.86% |
Similar Demographics by No Schooling Completed
Demographics Similar to Immigrants by No Schooling Completed
In terms of no schooling completed, the demographic groups most similar to Immigrants are Houma (2.8%, a difference of 0.10%), Immigrants from Eritrea (2.8%, a difference of 0.62%), Malaysian (2.8%, a difference of 0.79%), Immigrants from Cuba (2.8%, a difference of 1.1%), and Immigrants from Grenada (2.8%, a difference of 1.2%).
| Demographics | Rating | Rank | No Schooling Completed |
| Immigrants | Thailand | 0.0 /100 | #289 | Tragic 2.7% |
| Immigrants | Hong Kong | 0.0 /100 | #290 | Tragic 2.7% |
| British West Indians | 0.0 /100 | #291 | Tragic 2.7% |
| Immigrants | Grenada | 0.0 /100 | #292 | Tragic 2.8% |
| Malaysians | 0.0 /100 | #293 | Tragic 2.8% |
| Immigrants | Eritrea | 0.0 /100 | #294 | Tragic 2.8% |
| Houma | 0.0 /100 | #295 | Tragic 2.8% |
| Immigrants | Immigrants | 0.0 /100 | #296 | Tragic 2.8% |
| Immigrants | Cuba | 0.0 /100 | #297 | Tragic 2.8% |
| Immigrants | Dominica | 0.0 /100 | #298 | Tragic 2.8% |
| Central American Indians | 0.0 /100 | #299 | Tragic 2.8% |
| Haitians | 0.0 /100 | #300 | Tragic 2.9% |
| Immigrants | South Eastern Asia | 0.0 /100 | #301 | Tragic 2.9% |
| Immigrants | Caribbean | 0.0 /100 | #302 | Tragic 2.9% |
| Somalis | 0.0 /100 | #303 | Tragic 2.9% |
Demographics Similar to Immigrants from Croatia by No Schooling Completed
In terms of no schooling completed, the demographic groups most similar to Immigrants from Croatia are Cree (1.9%, a difference of 0.030%), Immigrants from Bulgaria (1.9%, a difference of 0.060%), Immigrants from Kuwait (1.9%, a difference of 0.39%), Iroquois (1.9%, a difference of 0.47%), and Cambodian (1.9%, a difference of 0.47%).
| Demographics | Rating | Rank | No Schooling Completed |
| Immigrants | Norway | 96.1 /100 | #114 | Exceptional 1.9% |
| Syrians | 96.0 /100 | #115 | Exceptional 1.9% |
| Lebanese | 96.0 /100 | #116 | Exceptional 1.9% |
| Immigrants | Serbia | 95.8 /100 | #117 | Exceptional 1.9% |
| Spanish | 95.5 /100 | #118 | Exceptional 1.9% |
| Iroquois | 95.1 /100 | #119 | Exceptional 1.9% |
| Immigrants | Bulgaria | 94.6 /100 | #120 | Exceptional 1.9% |
| Immigrants | Croatia | 94.5 /100 | #121 | Exceptional 1.9% |
| Cree | 94.5 /100 | #122 | Exceptional 1.9% |
| Immigrants | Kuwait | 93.9 /100 | #123 | Exceptional 1.9% |
| Cambodians | 93.8 /100 | #124 | Exceptional 1.9% |
| Immigrants | Europe | 93.7 /100 | #125 | Exceptional 1.9% |
| Immigrants | Romania | 92.6 /100 | #126 | Exceptional 1.9% |
| Israelis | 92.4 /100 | #127 | Exceptional 1.9% |
| Spaniards | 92.3 /100 | #128 | Exceptional 1.9% |