Pennsylvania German vs Immigrants from Lithuania 11th Grade
COMPARE
Pennsylvania German
Immigrants from Lithuania
11th Grade
11th Grade Comparison
Pennsylvania Germans
Immigrants from Lithuania
90.3%
11TH GRADE
0.0/ 100
METRIC RATING
288th/ 347
METRIC RANK
94.1%
11TH GRADE
99.9/ 100
METRIC RATING
39th/ 347
METRIC RANK
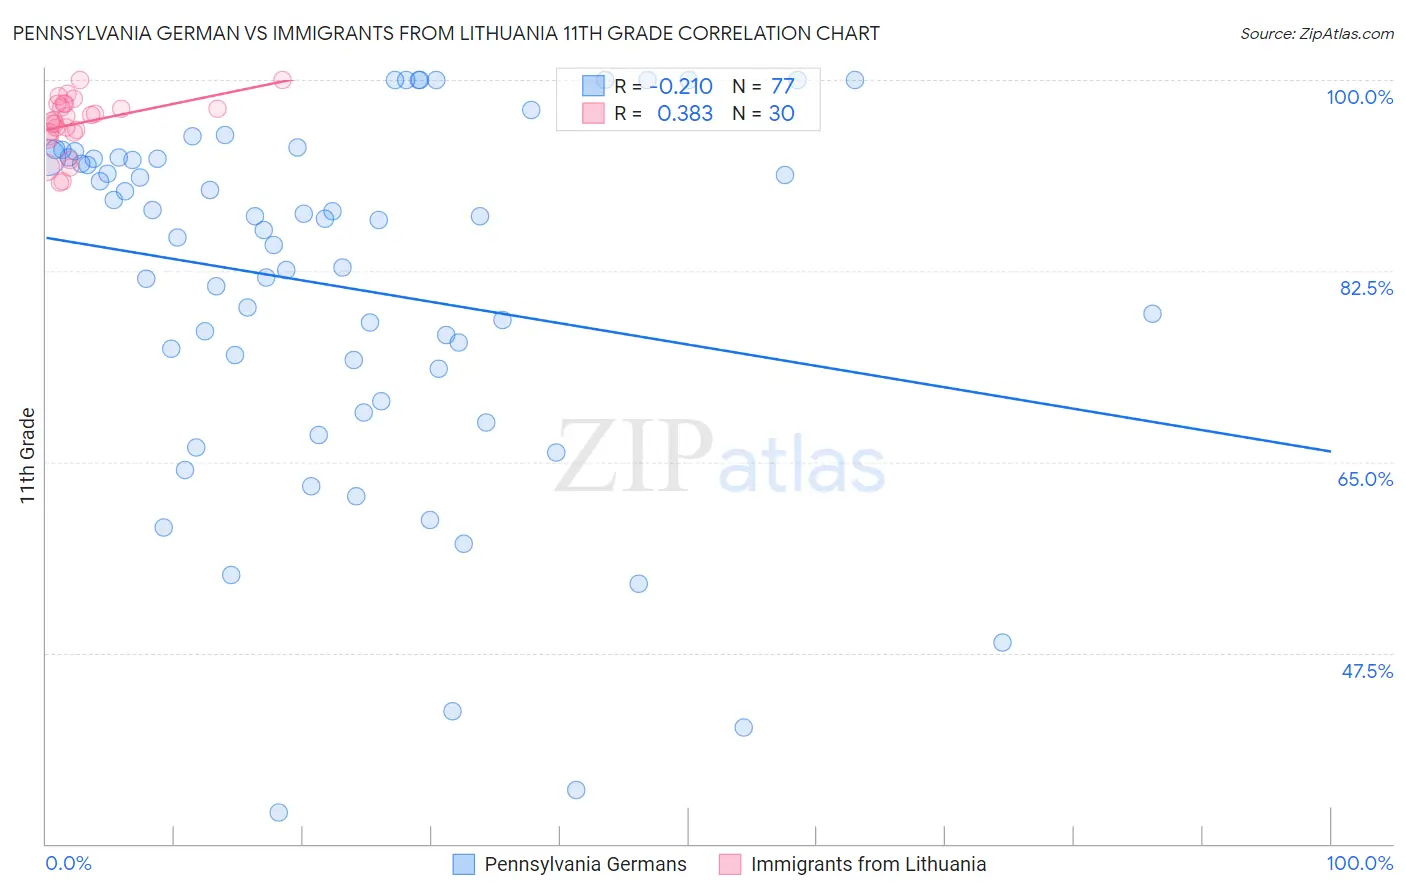
Pennsylvania German vs Immigrants from Lithuania 11th Grade Correlation Chart
The statistical analysis conducted on geographies consisting of 234,103,013 people shows a weak negative correlation between the proportion of Pennsylvania Germans and percentage of population with at least 11th grade education in the United States with a correlation coefficient (R) of -0.210 and weighted average of 90.3%. Similarly, the statistical analysis conducted on geographies consisting of 117,724,932 people shows a mild positive correlation between the proportion of Immigrants from Lithuania and percentage of population with at least 11th grade education in the United States with a correlation coefficient (R) of 0.383 and weighted average of 94.1%, a difference of 4.2%.
11th Grade Correlation Summary
| Measurement | Pennsylvania German | Immigrants from Lithuania |
| Minimum | 32.9% | 90.6% |
| Maximum | 100.0% | 100.0% |
| Range | 67.1% | 9.4% |
| Mean | 81.0% | 96.0% |
| Median | 87.1% | 96.2% |
| Interquartile 25% (IQ1) | 72.1% | 95.2% |
| Interquartile 75% (IQ3) | 92.9% | 97.8% |
| Interquartile Range (IQR) | 20.8% | 2.6% |
| Standard Deviation (Sample) | 16.6% | 2.5% |
| Standard Deviation (Population) | 16.4% | 2.4% |
Similar Demographics by 11th Grade
Demographics Similar to Pennsylvania Germans by 11th Grade
In terms of 11th grade, the demographic groups most similar to Pennsylvania Germans are Apache (90.4%, a difference of 0.020%), British West Indian (90.3%, a difference of 0.020%), Immigrants from West Indies (90.4%, a difference of 0.030%), Indonesian (90.3%, a difference of 0.050%), and Immigrants from Burma/Myanmar (90.4%, a difference of 0.080%).
| Demographics | Rating | Rank | 11th Grade |
| Dutch West Indians | 0.0 /100 | #281 | Tragic 90.7% |
| Immigrants | St. Vincent and the Grenadines | 0.0 /100 | #282 | Tragic 90.7% |
| Immigrants | Barbados | 0.0 /100 | #283 | Tragic 90.7% |
| Immigrants | Laos | 0.0 /100 | #284 | Tragic 90.5% |
| Immigrants | Burma/Myanmar | 0.0 /100 | #285 | Tragic 90.4% |
| Immigrants | West Indies | 0.0 /100 | #286 | Tragic 90.4% |
| Apache | 0.0 /100 | #287 | Tragic 90.4% |
| Pennsylvania Germans | 0.0 /100 | #288 | Tragic 90.3% |
| British West Indians | 0.0 /100 | #289 | Tragic 90.3% |
| Indonesians | 0.0 /100 | #290 | Tragic 90.3% |
| Haitians | 0.0 /100 | #291 | Tragic 90.3% |
| Cubans | 0.0 /100 | #292 | Tragic 90.2% |
| Natives/Alaskans | 0.0 /100 | #293 | Tragic 90.2% |
| Immigrants | Grenada | 0.0 /100 | #294 | Tragic 90.1% |
| Immigrants | Vietnam | 0.0 /100 | #295 | Tragic 90.0% |
Demographics Similar to Immigrants from Lithuania by 11th Grade
In terms of 11th grade, the demographic groups most similar to Immigrants from Lithuania are Thai (94.1%, a difference of 0.0%), Cypriot (94.1%, a difference of 0.010%), Immigrants from Austria (94.1%, a difference of 0.020%), Greek (94.1%, a difference of 0.020%), and Immigrants from Ireland (94.1%, a difference of 0.030%).
| Demographics | Rating | Rank | 11th Grade |
| Belgians | 99.9 /100 | #32 | Exceptional 94.2% |
| British | 99.9 /100 | #33 | Exceptional 94.2% |
| Immigrants | Scotland | 99.9 /100 | #34 | Exceptional 94.2% |
| Immigrants | Singapore | 99.9 /100 | #35 | Exceptional 94.2% |
| Immigrants | Northern Europe | 99.9 /100 | #36 | Exceptional 94.2% |
| Northern Europeans | 99.9 /100 | #37 | Exceptional 94.2% |
| Hungarians | 99.9 /100 | #38 | Exceptional 94.2% |
| Immigrants | Lithuania | 99.9 /100 | #39 | Exceptional 94.1% |
| Thais | 99.9 /100 | #40 | Exceptional 94.1% |
| Cypriots | 99.9 /100 | #41 | Exceptional 94.1% |
| Immigrants | Austria | 99.9 /100 | #42 | Exceptional 94.1% |
| Greeks | 99.9 /100 | #43 | Exceptional 94.1% |
| Immigrants | Ireland | 99.9 /100 | #44 | Exceptional 94.1% |
| Australians | 99.9 /100 | #45 | Exceptional 94.1% |
| Serbians | 99.9 /100 | #46 | Exceptional 94.1% |