Nigerian vs Immigrants from Ecuador Nursery School
COMPARE
Nigerian
Immigrants from Ecuador
Nursery School
Nursery School Comparison
Nigerians
Immigrants from Ecuador
97.7%
NURSERY SCHOOL
1.7/ 100
METRIC RATING
238th/ 347
METRIC RANK
96.9%
NURSERY SCHOOL
0.0/ 100
METRIC RATING
317th/ 347
METRIC RANK
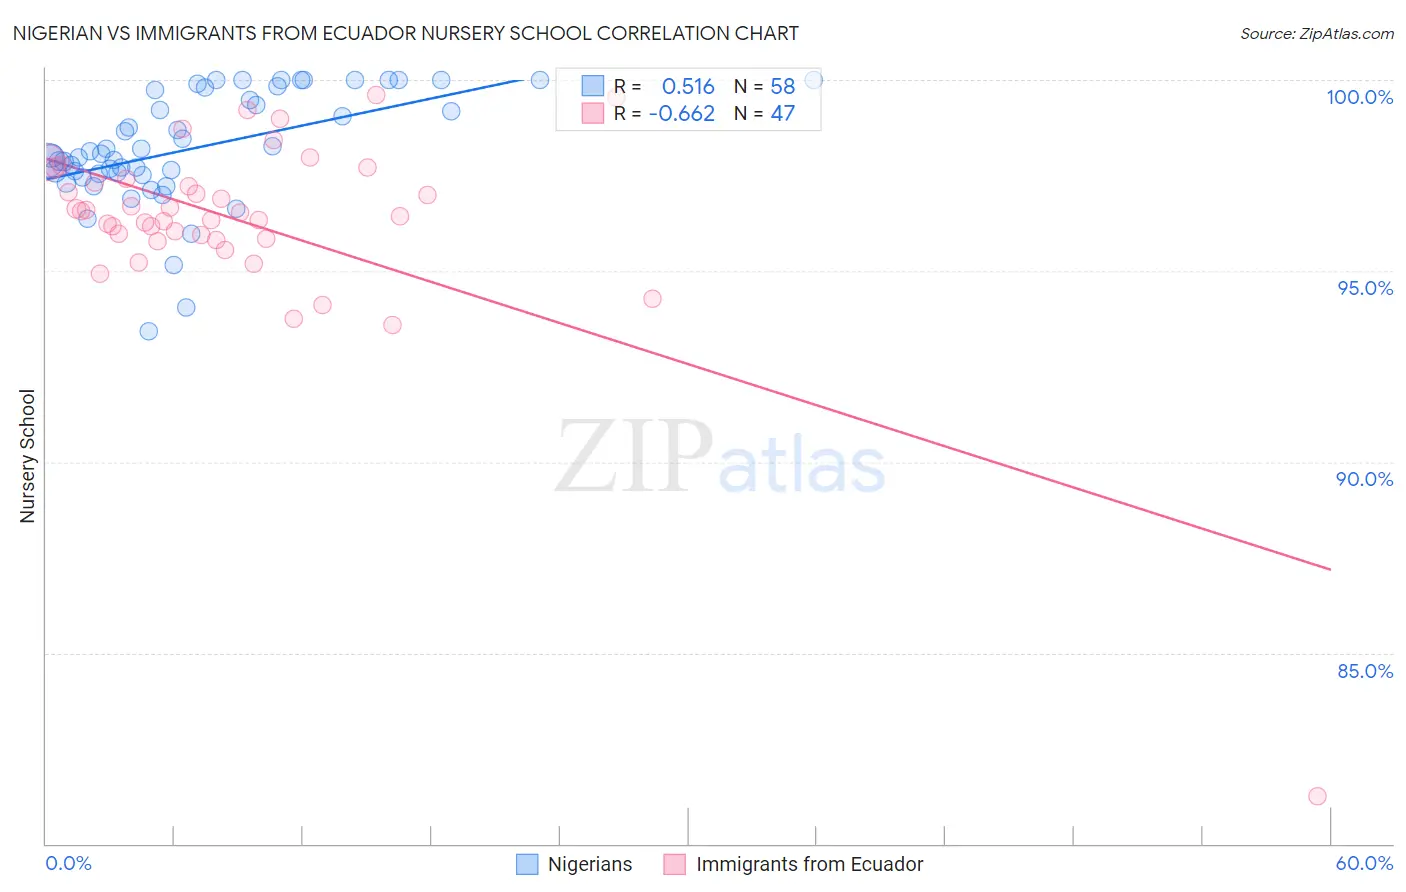
Nigerian vs Immigrants from Ecuador Nursery School Correlation Chart
The statistical analysis conducted on geographies consisting of 332,724,627 people shows a substantial positive correlation between the proportion of Nigerians and percentage of population with at least nursery school education in the United States with a correlation coefficient (R) of 0.516 and weighted average of 97.7%. Similarly, the statistical analysis conducted on geographies consisting of 271,020,679 people shows a significant negative correlation between the proportion of Immigrants from Ecuador and percentage of population with at least nursery school education in the United States with a correlation coefficient (R) of -0.662 and weighted average of 96.9%, a difference of 0.77%.
Nursery School Correlation Summary
| Measurement | Nigerian | Immigrants from Ecuador |
| Minimum | 93.4% | 81.2% |
| Maximum | 100.0% | 99.6% |
| Range | 6.6% | 18.3% |
| Mean | 98.2% | 96.3% |
| Median | 98.0% | 96.5% |
| Interquartile 25% (IQ1) | 97.5% | 95.8% |
| Interquartile 75% (IQ3) | 99.7% | 97.4% |
| Interquartile Range (IQR) | 2.2% | 1.6% |
| Standard Deviation (Sample) | 1.5% | 2.6% |
| Standard Deviation (Population) | 1.5% | 2.6% |
Similar Demographics by Nursery School
Demographics Similar to Nigerians by Nursery School
In terms of nursery school, the demographic groups most similar to Nigerians are Immigrants from Malaysia (97.7%, a difference of 0.010%), Immigrants from Western Asia (97.7%, a difference of 0.010%), Immigrants from Eastern Asia (97.7%, a difference of 0.010%), Korean (97.7%, a difference of 0.010%), and Immigrants from Uruguay (97.7%, a difference of 0.020%).
| Demographics | Rating | Rank | Nursery School |
| Puerto Ricans | 2.6 /100 | #231 | Tragic 97.7% |
| Immigrants | Uruguay | 2.3 /100 | #232 | Tragic 97.7% |
| U.S. Virgin Islanders | 2.1 /100 | #233 | Tragic 97.7% |
| Colombians | 2.1 /100 | #234 | Tragic 97.7% |
| Immigrants | Pakistan | 2.1 /100 | #235 | Tragic 97.7% |
| Immigrants | Malaysia | 1.9 /100 | #236 | Tragic 97.7% |
| Immigrants | Western Asia | 1.9 /100 | #237 | Tragic 97.7% |
| Nigerians | 1.7 /100 | #238 | Tragic 97.7% |
| Immigrants | Eastern Asia | 1.6 /100 | #239 | Tragic 97.7% |
| Koreans | 1.4 /100 | #240 | Tragic 97.7% |
| Immigrants | Indonesia | 1.1 /100 | #241 | Tragic 97.7% |
| Liberians | 1.1 /100 | #242 | Tragic 97.7% |
| Asians | 1.1 /100 | #243 | Tragic 97.6% |
| South Americans | 1.0 /100 | #244 | Tragic 97.6% |
| Bolivians | 1.0 /100 | #245 | Tragic 97.6% |
Demographics Similar to Immigrants from Ecuador by Nursery School
In terms of nursery school, the demographic groups most similar to Immigrants from Ecuador are Cape Verdean (97.0%, a difference of 0.010%), Immigrants from Nicaragua (96.9%, a difference of 0.010%), Immigrants from Belize (96.9%, a difference of 0.010%), Honduran (97.0%, a difference of 0.020%), and Immigrants from Guyana (96.9%, a difference of 0.040%).
| Demographics | Rating | Rank | Nursery School |
| Guyanese | 0.0 /100 | #310 | Tragic 97.0% |
| Immigrants | Azores | 0.0 /100 | #311 | Tragic 97.0% |
| Sri Lankans | 0.0 /100 | #312 | Tragic 97.0% |
| Hondurans | 0.0 /100 | #313 | Tragic 97.0% |
| Cape Verdeans | 0.0 /100 | #314 | Tragic 97.0% |
| Immigrants | Nicaragua | 0.0 /100 | #315 | Tragic 96.9% |
| Immigrants | Belize | 0.0 /100 | #316 | Tragic 96.9% |
| Immigrants | Ecuador | 0.0 /100 | #317 | Tragic 96.9% |
| Immigrants | Guyana | 0.0 /100 | #318 | Tragic 96.9% |
| Immigrants | Laos | 0.0 /100 | #319 | Tragic 96.9% |
| Immigrants | Burma/Myanmar | 0.0 /100 | #320 | Tragic 96.9% |
| Immigrants | Bangladesh | 0.0 /100 | #321 | Tragic 96.9% |
| Mexican American Indians | 0.0 /100 | #322 | Tragic 96.9% |
| Immigrants | Honduras | 0.0 /100 | #323 | Tragic 96.9% |
| Vietnamese | 0.0 /100 | #324 | Tragic 96.8% |