Costa Rican vs Chickasaw 11th Grade
COMPARE
Costa Rican
Chickasaw
11th Grade
11th Grade Comparison
Costa Ricans
Chickasaw
91.9%
11TH GRADE
6.3/ 100
METRIC RATING
224th/ 347
METRIC RANK
92.3%
11TH GRADE
31.4/ 100
METRIC RATING
190th/ 347
METRIC RANK
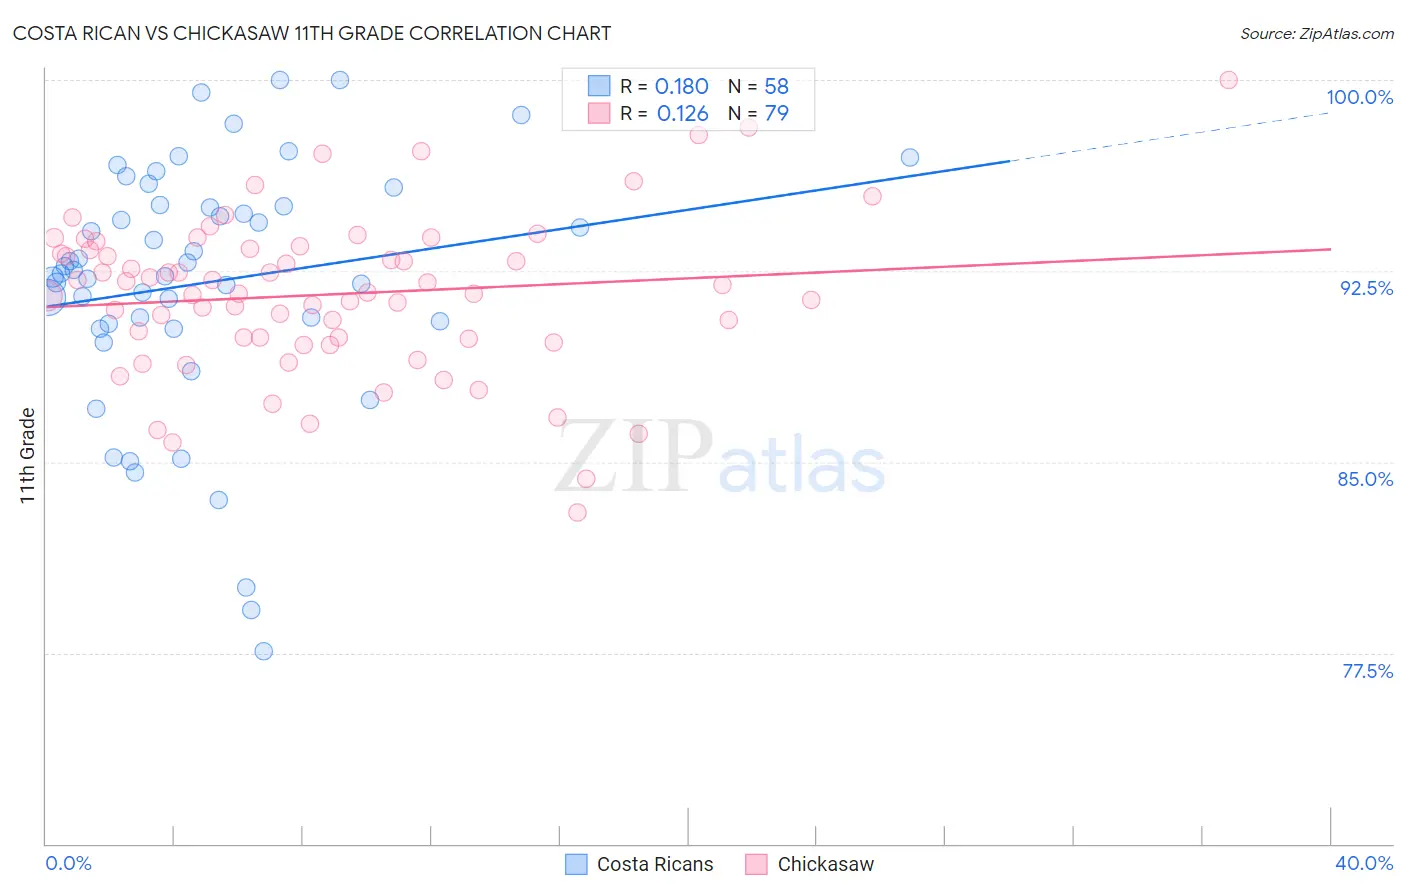
Costa Rican vs Chickasaw 11th Grade Correlation Chart
The statistical analysis conducted on geographies consisting of 253,601,730 people shows a poor positive correlation between the proportion of Costa Ricans and percentage of population with at least 11th grade education in the United States with a correlation coefficient (R) of 0.180 and weighted average of 91.9%. Similarly, the statistical analysis conducted on geographies consisting of 147,726,791 people shows a poor positive correlation between the proportion of Chickasaw and percentage of population with at least 11th grade education in the United States with a correlation coefficient (R) of 0.126 and weighted average of 92.3%, a difference of 0.48%.
11th Grade Correlation Summary
| Measurement | Costa Rican | Chickasaw |
| Minimum | 77.5% | 83.0% |
| Maximum | 100.0% | 100.0% |
| Range | 22.5% | 17.0% |
| Mean | 92.0% | 91.6% |
| Median | 92.5% | 91.6% |
| Interquartile 25% (IQ1) | 90.4% | 89.8% |
| Interquartile 75% (IQ3) | 95.1% | 93.4% |
| Interquartile Range (IQR) | 4.6% | 3.5% |
| Standard Deviation (Sample) | 4.9% | 3.1% |
| Standard Deviation (Population) | 4.9% | 3.1% |
Similar Demographics by 11th Grade
Demographics Similar to Costa Ricans by 11th Grade
In terms of 11th grade, the demographic groups most similar to Costa Ricans are Immigrants from Africa (91.9%, a difference of 0.010%), Immigrants from Bahamas (91.9%, a difference of 0.010%), Immigrants from Liberia (91.9%, a difference of 0.030%), Immigrants from Zaire (91.9%, a difference of 0.040%), and South American Indian (92.0%, a difference of 0.050%).
| Demographics | Rating | Rank | 11th Grade |
| Immigrants | Sierra Leone | 11.1 /100 | #217 | Poor 92.0% |
| Blackfeet | 10.1 /100 | #218 | Poor 92.0% |
| Portuguese | 10.0 /100 | #219 | Tragic 92.0% |
| South American Indians | 7.6 /100 | #220 | Tragic 92.0% |
| Immigrants | Liberia | 7.0 /100 | #221 | Tragic 91.9% |
| Immigrants | Africa | 6.5 /100 | #222 | Tragic 91.9% |
| Immigrants | Bahamas | 6.5 /100 | #223 | Tragic 91.9% |
| Costa Ricans | 6.3 /100 | #224 | Tragic 91.9% |
| Immigrants | Zaire | 5.4 /100 | #225 | Tragic 91.9% |
| Immigrants | Somalia | 5.2 /100 | #226 | Tragic 91.9% |
| Immigrants | Cameroon | 4.4 /100 | #227 | Tragic 91.8% |
| Immigrants | Panama | 4.3 /100 | #228 | Tragic 91.8% |
| Nigerians | 4.3 /100 | #229 | Tragic 91.8% |
| Immigrants | Afghanistan | 3.9 /100 | #230 | Tragic 91.8% |
| Choctaw | 3.7 /100 | #231 | Tragic 91.8% |
Demographics Similar to Chickasaw by 11th Grade
In terms of 11th grade, the demographic groups most similar to Chickasaw are French American Indian (92.3%, a difference of 0.010%), Immigrants from Syria (92.3%, a difference of 0.010%), Immigrants from Chile (92.4%, a difference of 0.020%), Immigrants from Indonesia (92.4%, a difference of 0.030%), and Moroccan (92.3%, a difference of 0.030%).
| Demographics | Rating | Rank | 11th Grade |
| Immigrants | Malaysia | 37.6 /100 | #183 | Fair 92.4% |
| Immigrants | Asia | 37.4 /100 | #184 | Fair 92.4% |
| Immigrants | Nepal | 36.4 /100 | #185 | Fair 92.4% |
| Arapaho | 35.1 /100 | #186 | Fair 92.4% |
| Immigrants | Western Asia | 35.0 /100 | #187 | Fair 92.4% |
| Immigrants | Indonesia | 33.7 /100 | #188 | Fair 92.4% |
| Immigrants | Chile | 33.3 /100 | #189 | Fair 92.4% |
| Chickasaw | 31.4 /100 | #190 | Fair 92.3% |
| French American Indians | 30.8 /100 | #191 | Fair 92.3% |
| Immigrants | Syria | 30.4 /100 | #192 | Fair 92.3% |
| Moroccans | 28.7 /100 | #193 | Fair 92.3% |
| Sioux | 28.5 /100 | #194 | Fair 92.3% |
| Liberians | 26.8 /100 | #195 | Fair 92.3% |
| Panamanians | 26.4 /100 | #196 | Fair 92.3% |
| Marshallese | 26.0 /100 | #197 | Fair 92.3% |