Immigrants from Zimbabwe vs Central American Indian GED/Equivalency
COMPARE
Immigrants from Zimbabwe
Central American Indian
GED/Equivalency
GED/Equivalency Comparison
Immigrants from Zimbabwe
Central American Indians
87.1%
GED/EQUIVALENCY
95.8/ 100
METRIC RATING
106th/ 347
METRIC RANK
80.6%
GED/EQUIVALENCY
0.0/ 100
METRIC RATING
316th/ 347
METRIC RANK
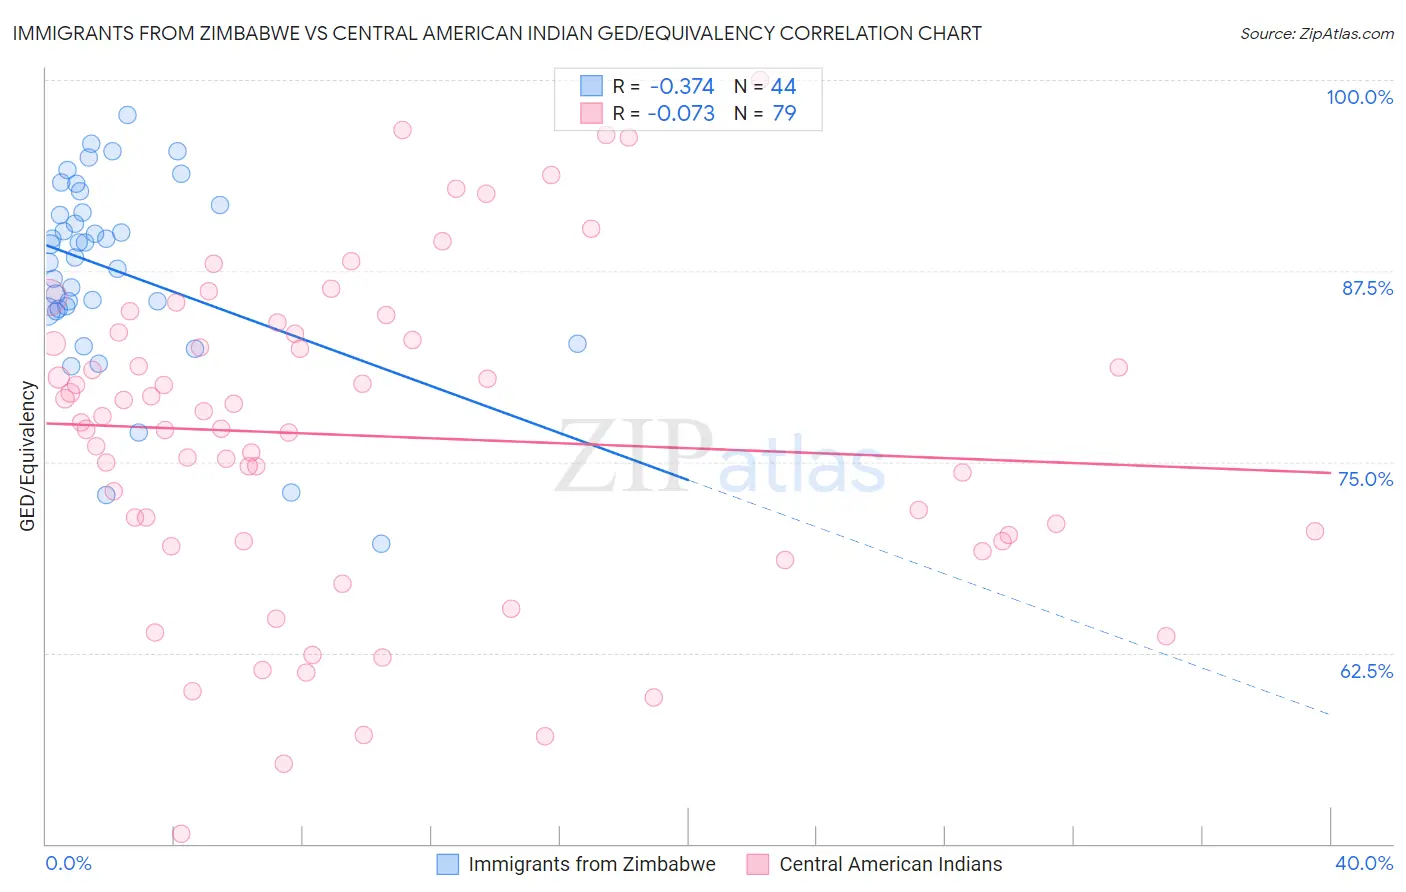
Immigrants from Zimbabwe vs Central American Indian GED/Equivalency Correlation Chart
The statistical analysis conducted on geographies consisting of 117,809,864 people shows a mild negative correlation between the proportion of Immigrants from Zimbabwe and percentage of population with at least ged/equivalency education in the United States with a correlation coefficient (R) of -0.374 and weighted average of 87.1%. Similarly, the statistical analysis conducted on geographies consisting of 326,142,643 people shows a slight negative correlation between the proportion of Central American Indians and percentage of population with at least ged/equivalency education in the United States with a correlation coefficient (R) of -0.073 and weighted average of 80.6%, a difference of 8.1%.
GED/Equivalency Correlation Summary
| Measurement | Immigrants from Zimbabwe | Central American Indian |
| Minimum | 69.6% | 50.7% |
| Maximum | 97.7% | 100.0% |
| Range | 28.1% | 49.3% |
| Mean | 87.5% | 76.7% |
| Median | 88.8% | 77.6% |
| Interquartile 25% (IQ1) | 84.9% | 69.8% |
| Interquartile 75% (IQ3) | 91.6% | 83.4% |
| Interquartile Range (IQR) | 6.6% | 13.6% |
| Standard Deviation (Sample) | 6.2% | 10.5% |
| Standard Deviation (Population) | 6.2% | 10.4% |
Similar Demographics by GED/Equivalency
Demographics Similar to Immigrants from Zimbabwe by GED/Equivalency
In terms of ged/equivalency, the demographic groups most similar to Immigrants from Zimbabwe are Icelander (87.1%, a difference of 0.010%), Indian (Asian) (87.1%, a difference of 0.020%), Immigrants from Hungary (87.2%, a difference of 0.030%), Canadian (87.1%, a difference of 0.030%), and Jordanian (87.2%, a difference of 0.040%).
| Demographics | Rating | Rank | GED/Equivalency |
| Immigrants | Belarus | 96.9 /100 | #99 | Exceptional 87.3% |
| Palestinians | 96.8 /100 | #100 | Exceptional 87.3% |
| Syrians | 96.6 /100 | #101 | Exceptional 87.2% |
| Lebanese | 96.2 /100 | #102 | Exceptional 87.2% |
| Jordanians | 96.1 /100 | #103 | Exceptional 87.2% |
| Immigrants | Hungary | 96.0 /100 | #104 | Exceptional 87.2% |
| Indians (Asian) | 95.9 /100 | #105 | Exceptional 87.1% |
| Immigrants | Zimbabwe | 95.8 /100 | #106 | Exceptional 87.1% |
| Icelanders | 95.7 /100 | #107 | Exceptional 87.1% |
| Canadians | 95.6 /100 | #108 | Exceptional 87.1% |
| Immigrants | Eastern Europe | 95.5 /100 | #109 | Exceptional 87.1% |
| Egyptians | 95.3 /100 | #110 | Exceptional 87.1% |
| French | 95.2 /100 | #111 | Exceptional 87.1% |
| Tlingit-Haida | 94.8 /100 | #112 | Exceptional 87.0% |
| Assyrians/Chaldeans/Syriacs | 94.8 /100 | #113 | Exceptional 87.0% |
Demographics Similar to Central American Indians by GED/Equivalency
In terms of ged/equivalency, the demographic groups most similar to Central American Indians are Immigrants from Caribbean (80.5%, a difference of 0.10%), Apache (80.7%, a difference of 0.13%), Yaqui (80.5%, a difference of 0.13%), Immigrants from Belize (80.5%, a difference of 0.13%), and Belizean (80.9%, a difference of 0.39%).
| Demographics | Rating | Rank | GED/Equivalency |
| Immigrants | Ecuador | 0.0 /100 | #309 | Tragic 81.0% |
| Immigrants | Guyana | 0.0 /100 | #310 | Tragic 81.0% |
| Natives/Alaskans | 0.0 /100 | #311 | Tragic 80.9% |
| Nicaraguans | 0.0 /100 | #312 | Tragic 80.9% |
| Cape Verdeans | 0.0 /100 | #313 | Tragic 80.9% |
| Belizeans | 0.0 /100 | #314 | Tragic 80.9% |
| Apache | 0.0 /100 | #315 | Tragic 80.7% |
| Central American Indians | 0.0 /100 | #316 | Tragic 80.6% |
| Immigrants | Caribbean | 0.0 /100 | #317 | Tragic 80.5% |
| Yaqui | 0.0 /100 | #318 | Tragic 80.5% |
| Immigrants | Belize | 0.0 /100 | #319 | Tragic 80.5% |
| Immigrants | Cuba | 0.0 /100 | #320 | Tragic 80.2% |
| Yup'ik | 0.0 /100 | #321 | Tragic 80.0% |
| Lumbee | 0.0 /100 | #322 | Tragic 80.0% |
| Immigrants | Nicaragua | 0.0 /100 | #323 | Tragic 79.9% |