Cree vs Central American Indian GED/Equivalency
COMPARE
Cree
Central American Indian
GED/Equivalency
GED/Equivalency Comparison
Cree
Central American Indians
85.0%
GED/EQUIVALENCY
15.9/ 100
METRIC RATING
202nd/ 347
METRIC RANK
80.6%
GED/EQUIVALENCY
0.0/ 100
METRIC RATING
316th/ 347
METRIC RANK
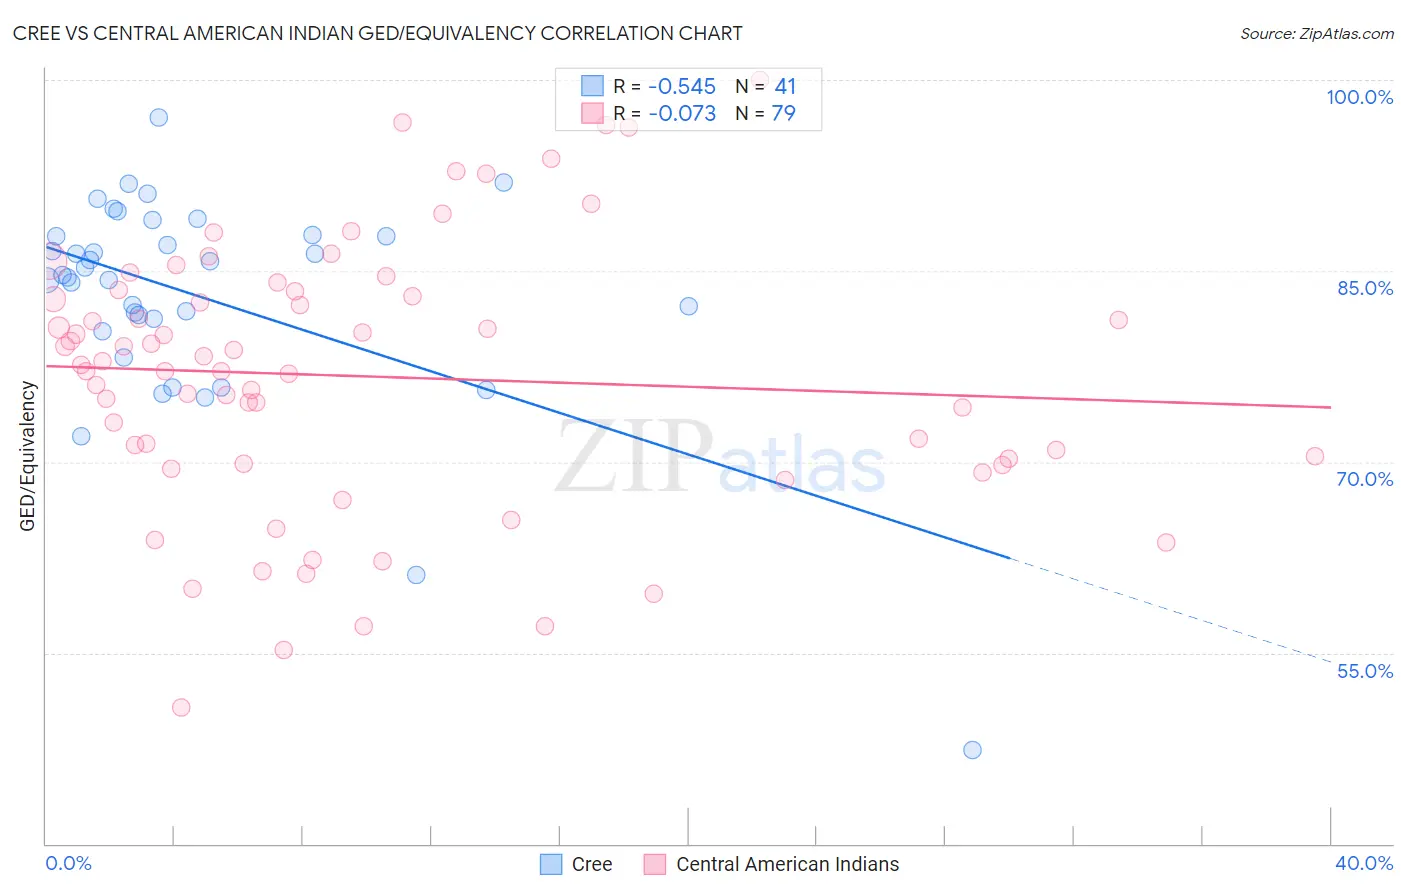
Cree vs Central American Indian GED/Equivalency Correlation Chart
The statistical analysis conducted on geographies consisting of 76,211,744 people shows a substantial negative correlation between the proportion of Cree and percentage of population with at least ged/equivalency education in the United States with a correlation coefficient (R) of -0.545 and weighted average of 85.0%. Similarly, the statistical analysis conducted on geographies consisting of 326,142,643 people shows a slight negative correlation between the proportion of Central American Indians and percentage of population with at least ged/equivalency education in the United States with a correlation coefficient (R) of -0.073 and weighted average of 80.6%, a difference of 5.5%.
GED/Equivalency Correlation Summary
| Measurement | Cree | Central American Indian |
| Minimum | 47.4% | 50.7% |
| Maximum | 97.0% | 100.0% |
| Range | 49.7% | 49.3% |
| Mean | 83.0% | 76.7% |
| Median | 84.7% | 77.6% |
| Interquartile 25% (IQ1) | 80.8% | 69.8% |
| Interquartile 75% (IQ3) | 87.8% | 83.4% |
| Interquartile Range (IQR) | 7.0% | 13.6% |
| Standard Deviation (Sample) | 8.7% | 10.5% |
| Standard Deviation (Population) | 8.5% | 10.4% |
Similar Demographics by GED/Equivalency
Demographics Similar to Cree by GED/Equivalency
In terms of ged/equivalency, the demographic groups most similar to Cree are Portuguese (85.0%, a difference of 0.0%), Uruguayan (85.0%, a difference of 0.010%), Somali (85.0%, a difference of 0.020%), Panamanian (85.0%, a difference of 0.020%), and Hawaiian (85.0%, a difference of 0.030%).
| Demographics | Rating | Rank | GED/Equivalency |
| Chippewa | 20.8 /100 | #195 | Fair 85.2% |
| Tongans | 20.7 /100 | #196 | Fair 85.2% |
| Costa Ricans | 20.4 /100 | #197 | Fair 85.2% |
| Immigrants | Africa | 17.5 /100 | #198 | Poor 85.1% |
| Somalis | 16.4 /100 | #199 | Poor 85.0% |
| Uruguayans | 16.0 /100 | #200 | Poor 85.0% |
| Portuguese | 15.9 /100 | #201 | Poor 85.0% |
| Cree | 15.9 /100 | #202 | Poor 85.0% |
| Panamanians | 15.3 /100 | #203 | Poor 85.0% |
| Hawaiians | 15.2 /100 | #204 | Poor 85.0% |
| Liberians | 14.6 /100 | #205 | Poor 85.0% |
| Samoans | 13.7 /100 | #206 | Poor 84.9% |
| Hmong | 13.1 /100 | #207 | Poor 84.9% |
| Marshallese | 12.5 /100 | #208 | Poor 84.9% |
| Colombians | 12.3 /100 | #209 | Poor 84.9% |
Demographics Similar to Central American Indians by GED/Equivalency
In terms of ged/equivalency, the demographic groups most similar to Central American Indians are Immigrants from Caribbean (80.5%, a difference of 0.10%), Apache (80.7%, a difference of 0.13%), Yaqui (80.5%, a difference of 0.13%), Immigrants from Belize (80.5%, a difference of 0.13%), and Belizean (80.9%, a difference of 0.39%).
| Demographics | Rating | Rank | GED/Equivalency |
| Immigrants | Ecuador | 0.0 /100 | #309 | Tragic 81.0% |
| Immigrants | Guyana | 0.0 /100 | #310 | Tragic 81.0% |
| Natives/Alaskans | 0.0 /100 | #311 | Tragic 80.9% |
| Nicaraguans | 0.0 /100 | #312 | Tragic 80.9% |
| Cape Verdeans | 0.0 /100 | #313 | Tragic 80.9% |
| Belizeans | 0.0 /100 | #314 | Tragic 80.9% |
| Apache | 0.0 /100 | #315 | Tragic 80.7% |
| Central American Indians | 0.0 /100 | #316 | Tragic 80.6% |
| Immigrants | Caribbean | 0.0 /100 | #317 | Tragic 80.5% |
| Yaqui | 0.0 /100 | #318 | Tragic 80.5% |
| Immigrants | Belize | 0.0 /100 | #319 | Tragic 80.5% |
| Immigrants | Cuba | 0.0 /100 | #320 | Tragic 80.2% |
| Yup'ik | 0.0 /100 | #321 | Tragic 80.0% |
| Lumbee | 0.0 /100 | #322 | Tragic 80.0% |
| Immigrants | Nicaragua | 0.0 /100 | #323 | Tragic 79.9% |