Immigrants from Zimbabwe vs Immigrants from Honduras GED/Equivalency
COMPARE
Immigrants from Zimbabwe
Immigrants from Honduras
GED/Equivalency
GED/Equivalency Comparison
Immigrants from Zimbabwe
Immigrants from Honduras
87.1%
GED/EQUIVALENCY
95.8/ 100
METRIC RATING
106th/ 347
METRIC RANK
78.7%
GED/EQUIVALENCY
0.0/ 100
METRIC RATING
331st/ 347
METRIC RANK
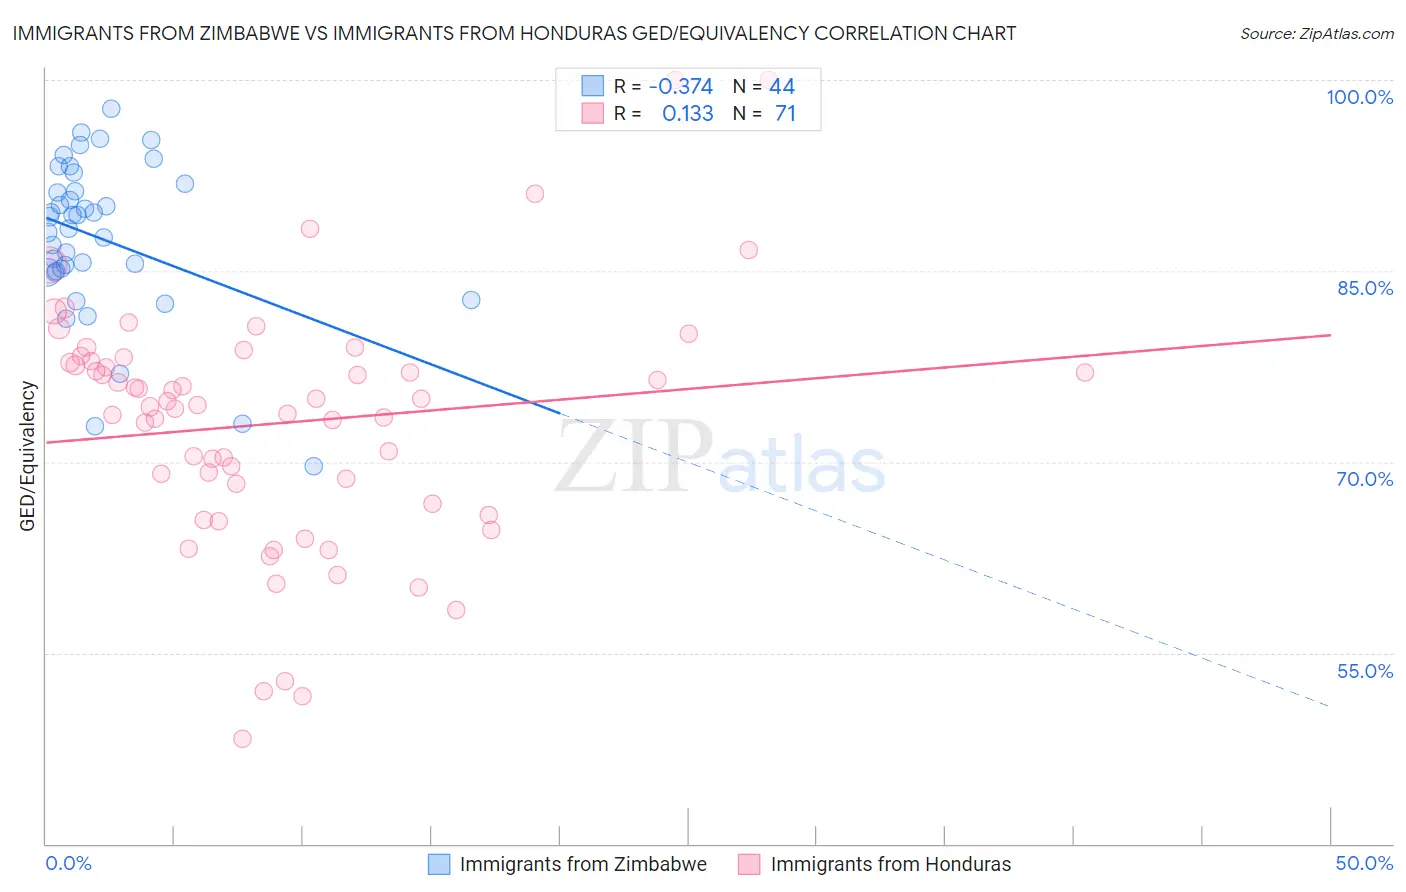
Immigrants from Zimbabwe vs Immigrants from Honduras GED/Equivalency Correlation Chart
The statistical analysis conducted on geographies consisting of 117,809,864 people shows a mild negative correlation between the proportion of Immigrants from Zimbabwe and percentage of population with at least ged/equivalency education in the United States with a correlation coefficient (R) of -0.374 and weighted average of 87.1%. Similarly, the statistical analysis conducted on geographies consisting of 322,637,196 people shows a poor positive correlation between the proportion of Immigrants from Honduras and percentage of population with at least ged/equivalency education in the United States with a correlation coefficient (R) of 0.133 and weighted average of 78.7%, a difference of 10.7%.
GED/Equivalency Correlation Summary
| Measurement | Immigrants from Zimbabwe | Immigrants from Honduras |
| Minimum | 69.6% | 48.2% |
| Maximum | 97.7% | 100.0% |
| Range | 28.1% | 51.8% |
| Mean | 87.5% | 73.0% |
| Median | 88.8% | 74.5% |
| Interquartile 25% (IQ1) | 84.9% | 66.7% |
| Interquartile 75% (IQ3) | 91.6% | 78.0% |
| Interquartile Range (IQR) | 6.6% | 11.2% |
| Standard Deviation (Sample) | 6.2% | 9.7% |
| Standard Deviation (Population) | 6.2% | 9.7% |
Similar Demographics by GED/Equivalency
Demographics Similar to Immigrants from Zimbabwe by GED/Equivalency
In terms of ged/equivalency, the demographic groups most similar to Immigrants from Zimbabwe are Icelander (87.1%, a difference of 0.010%), Indian (Asian) (87.1%, a difference of 0.020%), Immigrants from Hungary (87.2%, a difference of 0.030%), Canadian (87.1%, a difference of 0.030%), and Jordanian (87.2%, a difference of 0.040%).
| Demographics | Rating | Rank | GED/Equivalency |
| Immigrants | Belarus | 96.9 /100 | #99 | Exceptional 87.3% |
| Palestinians | 96.8 /100 | #100 | Exceptional 87.3% |
| Syrians | 96.6 /100 | #101 | Exceptional 87.2% |
| Lebanese | 96.2 /100 | #102 | Exceptional 87.2% |
| Jordanians | 96.1 /100 | #103 | Exceptional 87.2% |
| Immigrants | Hungary | 96.0 /100 | #104 | Exceptional 87.2% |
| Indians (Asian) | 95.9 /100 | #105 | Exceptional 87.1% |
| Immigrants | Zimbabwe | 95.8 /100 | #106 | Exceptional 87.1% |
| Icelanders | 95.7 /100 | #107 | Exceptional 87.1% |
| Canadians | 95.6 /100 | #108 | Exceptional 87.1% |
| Immigrants | Eastern Europe | 95.5 /100 | #109 | Exceptional 87.1% |
| Egyptians | 95.3 /100 | #110 | Exceptional 87.1% |
| French | 95.2 /100 | #111 | Exceptional 87.1% |
| Tlingit-Haida | 94.8 /100 | #112 | Exceptional 87.0% |
| Assyrians/Chaldeans/Syriacs | 94.8 /100 | #113 | Exceptional 87.0% |
Demographics Similar to Immigrants from Honduras by GED/Equivalency
In terms of ged/equivalency, the demographic groups most similar to Immigrants from Honduras are Immigrants from the Azores (78.7%, a difference of 0.11%), Salvadoran (78.6%, a difference of 0.22%), Immigrants from Cabo Verde (78.9%, a difference of 0.24%), Guatemalan (78.5%, a difference of 0.31%), and Immigrants from Latin America (78.5%, a difference of 0.33%).
| Demographics | Rating | Rank | GED/Equivalency |
| Mexican American Indians | 0.0 /100 | #324 | Tragic 79.4% |
| Hondurans | 0.0 /100 | #325 | Tragic 79.3% |
| Yuman | 0.0 /100 | #326 | Tragic 79.2% |
| Central Americans | 0.0 /100 | #327 | Tragic 79.2% |
| Hispanics or Latinos | 0.0 /100 | #328 | Tragic 79.1% |
| Dominicans | 0.0 /100 | #329 | Tragic 79.1% |
| Immigrants | Cabo Verde | 0.0 /100 | #330 | Tragic 78.9% |
| Immigrants | Honduras | 0.0 /100 | #331 | Tragic 78.7% |
| Immigrants | Azores | 0.0 /100 | #332 | Tragic 78.7% |
| Salvadorans | 0.0 /100 | #333 | Tragic 78.6% |
| Guatemalans | 0.0 /100 | #334 | Tragic 78.5% |
| Immigrants | Latin America | 0.0 /100 | #335 | Tragic 78.5% |
| Immigrants | Dominican Republic | 0.0 /100 | #336 | Tragic 78.0% |
| Immigrants | Yemen | 0.0 /100 | #337 | Tragic 77.9% |
| Immigrants | Guatemala | 0.0 /100 | #338 | Tragic 77.9% |