Immigrants from Yemen vs Tsimshian Vision Disability
COMPARE
Immigrants from Yemen
Tsimshian
Vision Disability
Vision Disability Comparison
Immigrants from Yemen
Tsimshian
2.6%
VISION DISABILITY
0.0/ 100
METRIC RATING
309th/ 347
METRIC RANK
3.2%
VISION DISABILITY
0.0/ 100
METRIC RATING
339th/ 347
METRIC RANK
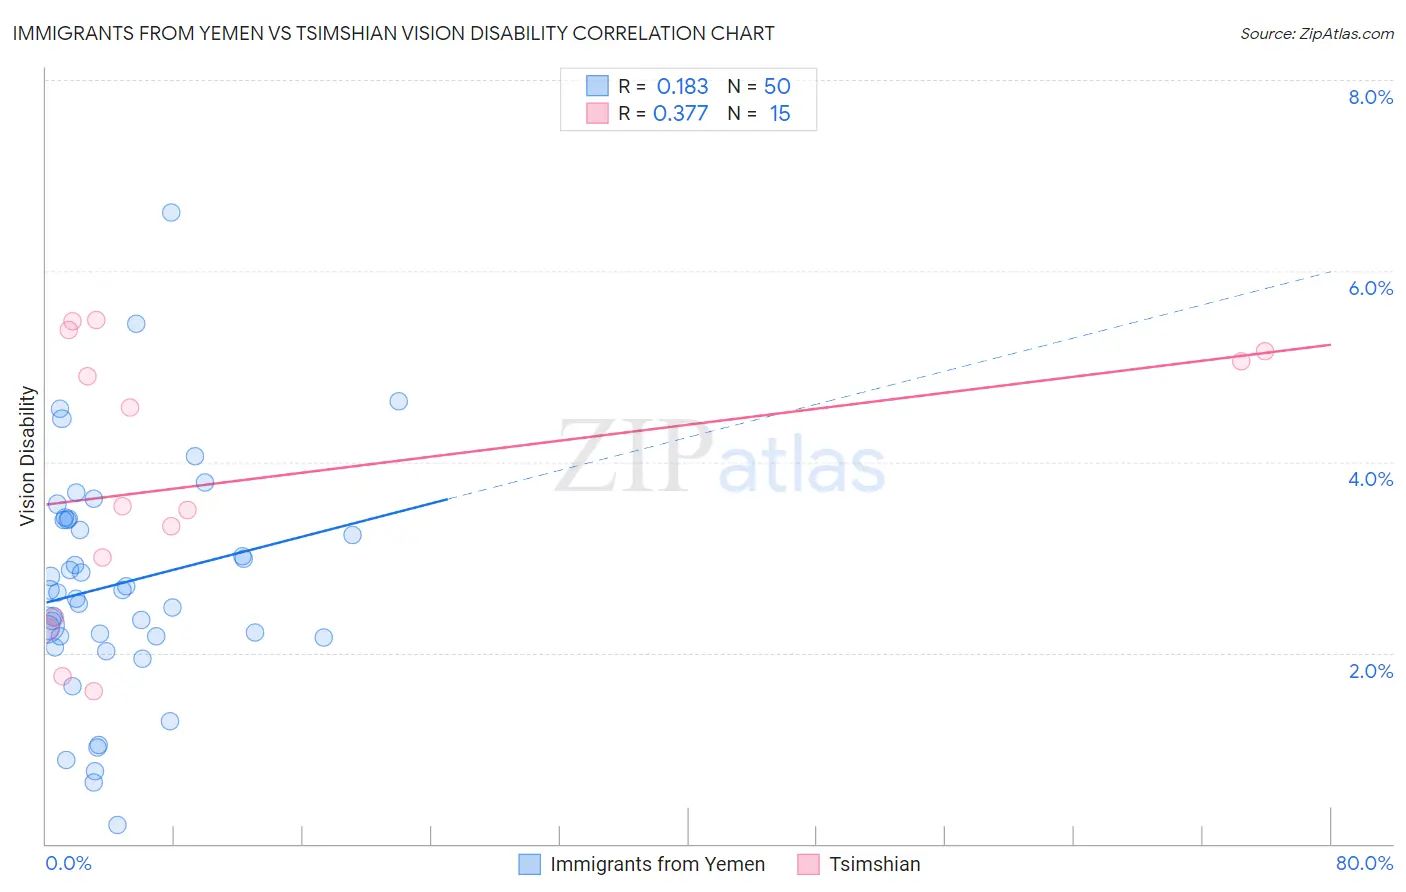
Immigrants from Yemen vs Tsimshian Vision Disability Correlation Chart
The statistical analysis conducted on geographies consisting of 82,432,015 people shows a poor positive correlation between the proportion of Immigrants from Yemen and percentage of population with vision disability in the United States with a correlation coefficient (R) of 0.183 and weighted average of 2.6%. Similarly, the statistical analysis conducted on geographies consisting of 15,626,544 people shows a mild positive correlation between the proportion of Tsimshian and percentage of population with vision disability in the United States with a correlation coefficient (R) of 0.377 and weighted average of 3.2%, a difference of 22.3%.
Vision Disability Correlation Summary
| Measurement | Immigrants from Yemen | Tsimshian |
| Minimum | 0.20% | 1.6% |
| Maximum | 6.6% | 5.5% |
| Range | 6.4% | 3.9% |
| Mean | 2.7% | 3.8% |
| Median | 2.6% | 3.5% |
| Interquartile 25% (IQ1) | 2.2% | 2.4% |
| Interquartile 75% (IQ3) | 3.4% | 5.2% |
| Interquartile Range (IQR) | 1.2% | 2.8% |
| Standard Deviation (Sample) | 1.2% | 1.4% |
| Standard Deviation (Population) | 1.2% | 1.4% |
Similar Demographics by Vision Disability
Demographics Similar to Immigrants from Yemen by Vision Disability
In terms of vision disability, the demographic groups most similar to Immigrants from Yemen are Arapaho (2.6%, a difference of 0.29%), Immigrants from Dominican Republic (2.6%, a difference of 0.30%), Blackfeet (2.6%, a difference of 0.32%), Iroquois (2.6%, a difference of 0.33%), and Dominican (2.6%, a difference of 0.37%).
| Demographics | Rating | Rank | Vision Disability |
| Spanish American Indians | 0.0 /100 | #302 | Tragic 2.6% |
| Immigrants | Cabo Verde | 0.0 /100 | #303 | Tragic 2.6% |
| Aleuts | 0.0 /100 | #304 | Tragic 2.6% |
| Hispanics or Latinos | 0.0 /100 | #305 | Tragic 2.6% |
| Iroquois | 0.0 /100 | #306 | Tragic 2.6% |
| Immigrants | Dominican Republic | 0.0 /100 | #307 | Tragic 2.6% |
| Arapaho | 0.0 /100 | #308 | Tragic 2.6% |
| Immigrants | Yemen | 0.0 /100 | #309 | Tragic 2.6% |
| Blackfeet | 0.0 /100 | #310 | Tragic 2.6% |
| Dominicans | 0.0 /100 | #311 | Tragic 2.6% |
| Americans | 0.0 /100 | #312 | Tragic 2.6% |
| Potawatomi | 0.0 /100 | #313 | Tragic 2.6% |
| Inupiat | 0.0 /100 | #314 | Tragic 2.7% |
| Osage | 0.0 /100 | #315 | Tragic 2.7% |
| Shoshone | 0.0 /100 | #316 | Tragic 2.7% |
Demographics Similar to Tsimshian by Vision Disability
In terms of vision disability, the demographic groups most similar to Tsimshian are Creek (3.2%, a difference of 0.13%), Chickasaw (3.2%, a difference of 0.69%), Kiowa (3.3%, a difference of 1.6%), Dutch West Indian (3.2%, a difference of 1.6%), and Alaskan Athabascan (3.1%, a difference of 1.6%).
| Demographics | Rating | Rank | Vision Disability |
| Seminole | 0.0 /100 | #332 | Tragic 3.1% |
| Cajuns | 0.0 /100 | #333 | Tragic 3.1% |
| Cheyenne | 0.0 /100 | #334 | Tragic 3.1% |
| Navajo | 0.0 /100 | #335 | Tragic 3.1% |
| Alaskan Athabascans | 0.0 /100 | #336 | Tragic 3.1% |
| Dutch West Indians | 0.0 /100 | #337 | Tragic 3.2% |
| Chickasaw | 0.0 /100 | #338 | Tragic 3.2% |
| Tsimshian | 0.0 /100 | #339 | Tragic 3.2% |
| Creek | 0.0 /100 | #340 | Tragic 3.2% |
| Kiowa | 0.0 /100 | #341 | Tragic 3.3% |
| Choctaw | 0.0 /100 | #342 | Tragic 3.3% |
| Pima | 0.0 /100 | #343 | Tragic 3.3% |
| Pueblo | 0.0 /100 | #344 | Tragic 3.3% |
| Lumbee | 0.0 /100 | #345 | Tragic 3.4% |
| Houma | 0.0 /100 | #346 | Tragic 3.4% |