Immigrants from Yemen vs Aleut Associate's Degree
COMPARE
Immigrants from Yemen
Aleut
Associate's Degree
Associate's Degree Comparison
Immigrants from Yemen
Aleuts
37.3%
ASSOCIATE'S DEGREE
0.0/ 100
METRIC RATING
321st/ 347
METRIC RANK
39.6%
ASSOCIATE'S DEGREE
0.0/ 100
METRIC RATING
287th/ 347
METRIC RANK
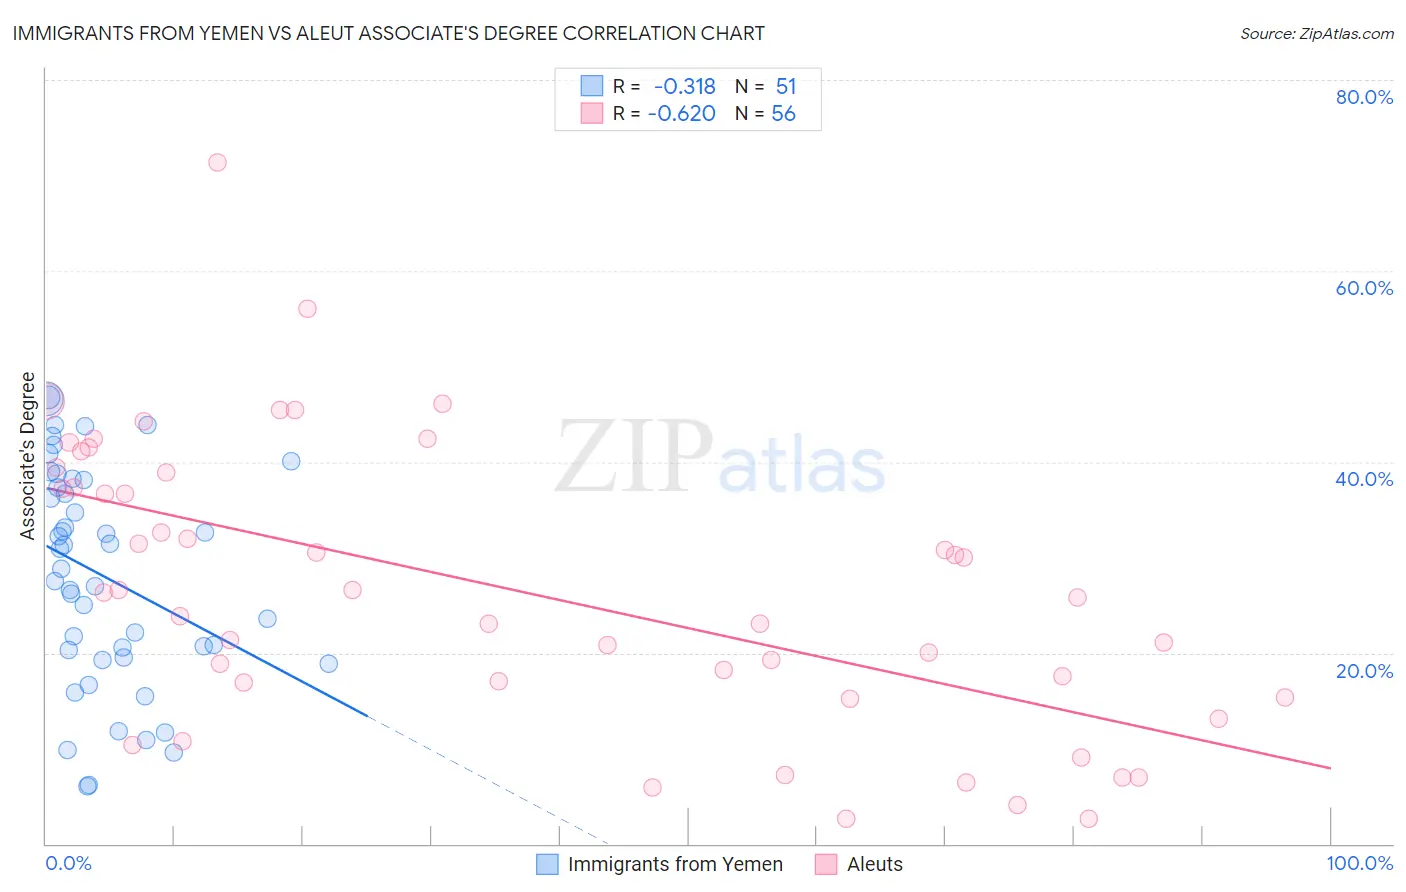
Immigrants from Yemen vs Aleut Associate's Degree Correlation Chart
The statistical analysis conducted on geographies consisting of 82,433,611 people shows a mild negative correlation between the proportion of Immigrants from Yemen and percentage of population with at least associate's degree education in the United States with a correlation coefficient (R) of -0.318 and weighted average of 37.3%. Similarly, the statistical analysis conducted on geographies consisting of 61,782,803 people shows a significant negative correlation between the proportion of Aleuts and percentage of population with at least associate's degree education in the United States with a correlation coefficient (R) of -0.620 and weighted average of 39.6%, a difference of 6.2%.
Associate's Degree Correlation Summary
| Measurement | Immigrants from Yemen | Aleut |
| Minimum | 6.0% | 2.6% |
| Maximum | 46.7% | 71.3% |
| Range | 40.7% | 68.7% |
| Mean | 28.0% | 26.6% |
| Median | 28.8% | 26.0% |
| Interquartile 25% (IQ1) | 19.5% | 16.1% |
| Interquartile 75% (IQ3) | 38.1% | 38.1% |
| Interquartile Range (IQR) | 18.6% | 22.0% |
| Standard Deviation (Sample) | 11.4% | 14.9% |
| Standard Deviation (Population) | 11.3% | 14.8% |
Similar Demographics by Associate's Degree
Demographics Similar to Immigrants from Yemen by Associate's Degree
In terms of associate's degree, the demographic groups most similar to Immigrants from Yemen are Cajun (37.4%, a difference of 0.12%), Fijian (37.4%, a difference of 0.15%), Pennsylvania German (37.2%, a difference of 0.29%), Alaska Native (37.5%, a difference of 0.37%), and Yaqui (37.6%, a difference of 0.60%).
| Demographics | Rating | Rank | Associate's Degree |
| Seminole | 0.0 /100 | #314 | Tragic 37.7% |
| Creek | 0.0 /100 | #315 | Tragic 37.6% |
| Crow | 0.0 /100 | #316 | Tragic 37.6% |
| Yaqui | 0.0 /100 | #317 | Tragic 37.6% |
| Alaska Natives | 0.0 /100 | #318 | Tragic 37.5% |
| Fijians | 0.0 /100 | #319 | Tragic 37.4% |
| Cajuns | 0.0 /100 | #320 | Tragic 37.4% |
| Immigrants | Yemen | 0.0 /100 | #321 | Tragic 37.3% |
| Pennsylvania Germans | 0.0 /100 | #322 | Tragic 37.2% |
| Immigrants | Cabo Verde | 0.0 /100 | #323 | Tragic 36.8% |
| Arapaho | 0.0 /100 | #324 | Tragic 36.7% |
| Menominee | 0.0 /100 | #325 | Tragic 36.7% |
| Kiowa | 0.0 /100 | #326 | Tragic 36.5% |
| Dutch West Indians | 0.0 /100 | #327 | Tragic 36.5% |
| Alaskan Athabascans | 0.0 /100 | #328 | Tragic 36.5% |
Demographics Similar to Aleuts by Associate's Degree
In terms of associate's degree, the demographic groups most similar to Aleuts are Immigrants from Cuba (39.5%, a difference of 0.24%), Immigrants from Caribbean (39.7%, a difference of 0.26%), Central American (39.4%, a difference of 0.50%), Immigrants from Belize (39.9%, a difference of 0.60%), and Comanche (39.9%, a difference of 0.70%).
| Demographics | Rating | Rank | Associate's Degree |
| Immigrants | Micronesia | 0.1 /100 | #280 | Tragic 40.2% |
| Immigrants | Portugal | 0.1 /100 | #281 | Tragic 40.1% |
| Bangladeshis | 0.1 /100 | #282 | Tragic 40.0% |
| Haitians | 0.1 /100 | #283 | Tragic 40.0% |
| Comanche | 0.1 /100 | #284 | Tragic 39.9% |
| Immigrants | Belize | 0.1 /100 | #285 | Tragic 39.9% |
| Immigrants | Caribbean | 0.0 /100 | #286 | Tragic 39.7% |
| Aleuts | 0.0 /100 | #287 | Tragic 39.6% |
| Immigrants | Cuba | 0.0 /100 | #288 | Tragic 39.5% |
| Central Americans | 0.0 /100 | #289 | Tragic 39.4% |
| Immigrants | Haiti | 0.0 /100 | #290 | Tragic 39.3% |
| Dominicans | 0.0 /100 | #291 | Tragic 39.3% |
| Blacks/African Americans | 0.0 /100 | #292 | Tragic 39.1% |
| Nepalese | 0.0 /100 | #293 | Tragic 39.0% |
| Salvadorans | 0.0 /100 | #294 | Tragic 39.0% |