Immigrants from Yemen vs Tsimshian Single Father Households
COMPARE
Immigrants from Yemen
Tsimshian
Single Father Households
Single Father Households Comparison
Immigrants from Yemen
Tsimshian
2.2%
SINGLE FATHER HOUSEHOLDS
97.5/ 100
METRIC RATING
123rd/ 347
METRIC RANK
2.9%
SINGLE FATHER HOUSEHOLDS
0.0/ 100
METRIC RATING
312th/ 347
METRIC RANK
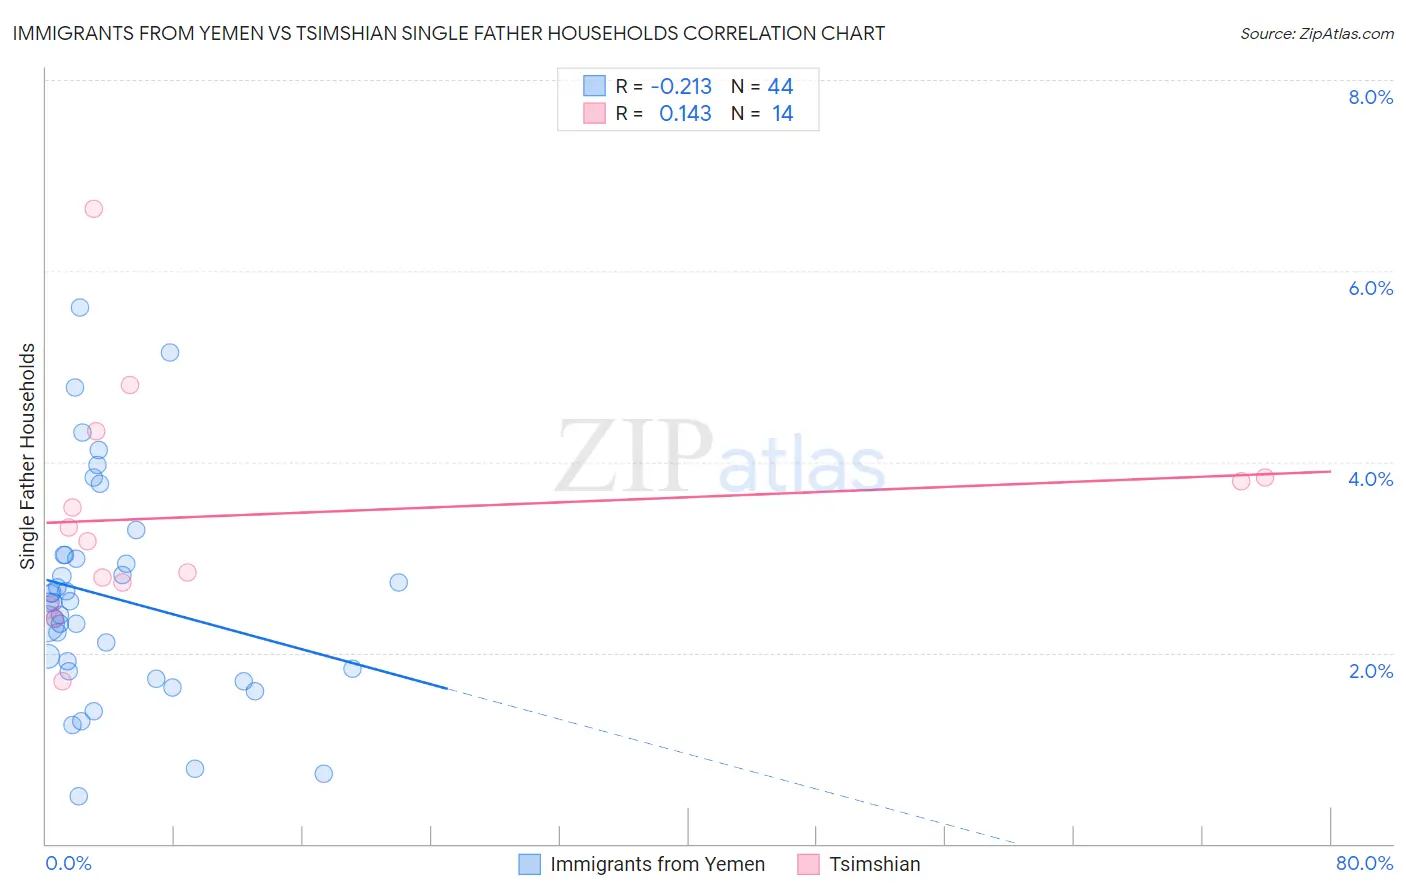
Immigrants from Yemen vs Tsimshian Single Father Households Correlation Chart
The statistical analysis conducted on geographies consisting of 82,364,844 people shows a weak negative correlation between the proportion of Immigrants from Yemen and percentage of single father households in the United States with a correlation coefficient (R) of -0.213 and weighted average of 2.2%. Similarly, the statistical analysis conducted on geographies consisting of 15,613,275 people shows a poor positive correlation between the proportion of Tsimshian and percentage of single father households in the United States with a correlation coefficient (R) of 0.143 and weighted average of 2.9%, a difference of 32.5%.
Single Father Households Correlation Summary
| Measurement | Immigrants from Yemen | Tsimshian |
| Minimum | 0.50% | 1.7% |
| Maximum | 5.6% | 6.6% |
| Range | 5.1% | 4.9% |
| Mean | 2.6% | 3.5% |
| Median | 2.5% | 3.2% |
| Interquartile 25% (IQ1) | 1.8% | 2.7% |
| Interquartile 75% (IQ3) | 3.0% | 3.8% |
| Interquartile Range (IQR) | 1.2% | 1.1% |
| Standard Deviation (Sample) | 1.1% | 1.2% |
| Standard Deviation (Population) | 1.1% | 1.2% |
Similar Demographics by Single Father Households
Demographics Similar to Immigrants from Yemen by Single Father Households
In terms of single father households, the demographic groups most similar to Immigrants from Yemen are British West Indian (2.2%, a difference of 0.020%), Immigrants from Indonesia (2.2%, a difference of 0.070%), Immigrants from Iraq (2.2%, a difference of 0.15%), Australian (2.2%, a difference of 0.25%), and Immigrants from Brazil (2.2%, a difference of 0.25%).
| Demographics | Rating | Rank | Single Father Households |
| Immigrants | Argentina | 98.1 /100 | #116 | Exceptional 2.2% |
| Hungarians | 97.9 /100 | #117 | Exceptional 2.2% |
| Immigrants | Morocco | 97.8 /100 | #118 | Exceptional 2.2% |
| Trinidadians and Tobagonians | 97.8 /100 | #119 | Exceptional 2.2% |
| Australians | 97.7 /100 | #120 | Exceptional 2.2% |
| Immigrants | Brazil | 97.7 /100 | #121 | Exceptional 2.2% |
| Immigrants | Iraq | 97.6 /100 | #122 | Exceptional 2.2% |
| Immigrants | Yemen | 97.5 /100 | #123 | Exceptional 2.2% |
| British West Indians | 97.4 /100 | #124 | Exceptional 2.2% |
| Immigrants | Indonesia | 97.4 /100 | #125 | Exceptional 2.2% |
| Moroccans | 96.9 /100 | #126 | Exceptional 2.2% |
| Jordanians | 96.9 /100 | #127 | Exceptional 2.2% |
| Immigrants | England | 96.8 /100 | #128 | Exceptional 2.2% |
| Serbians | 96.8 /100 | #129 | Exceptional 2.2% |
| Immigrants | Chile | 96.7 /100 | #130 | Exceptional 2.2% |
Demographics Similar to Tsimshian by Single Father Households
In terms of single father households, the demographic groups most similar to Tsimshian are Arapaho (2.9%, a difference of 0.42%), Spanish American Indian (2.9%, a difference of 0.57%), Salvadoran (2.9%, a difference of 0.67%), Immigrants from Laos (2.9%, a difference of 1.1%), and Cheyenne (2.9%, a difference of 1.1%).
| Demographics | Rating | Rank | Single Father Households |
| Hispanics or Latinos | 0.0 /100 | #305 | Tragic 2.8% |
| Immigrants | Azores | 0.0 /100 | #306 | Tragic 2.8% |
| Hopi | 0.0 /100 | #307 | Tragic 2.8% |
| Apache | 0.0 /100 | #308 | Tragic 2.8% |
| Central Americans | 0.0 /100 | #309 | Tragic 2.9% |
| Immigrants | Laos | 0.0 /100 | #310 | Tragic 2.9% |
| Spanish American Indians | 0.0 /100 | #311 | Tragic 2.9% |
| Tsimshian | 0.0 /100 | #312 | Tragic 2.9% |
| Arapaho | 0.0 /100 | #313 | Tragic 2.9% |
| Salvadorans | 0.0 /100 | #314 | Tragic 2.9% |
| Cheyenne | 0.0 /100 | #315 | Tragic 2.9% |
| Houma | 0.0 /100 | #316 | Tragic 2.9% |
| Immigrants | El Salvador | 0.0 /100 | #317 | Tragic 2.9% |
| Cape Verdeans | 0.0 /100 | #318 | Tragic 2.9% |
| Ute | 0.0 /100 | #319 | Tragic 3.0% |