Immigrants from Yemen vs Immigrants from Bulgaria Associate's Degree
COMPARE
Immigrants from Yemen
Immigrants from Bulgaria
Associate's Degree
Associate's Degree Comparison
Immigrants from Yemen
Immigrants from Bulgaria
37.3%
ASSOCIATE'S DEGREE
0.0/ 100
METRIC RATING
321st/ 347
METRIC RANK
52.4%
ASSOCIATE'S DEGREE
99.9/ 100
METRIC RATING
46th/ 347
METRIC RANK
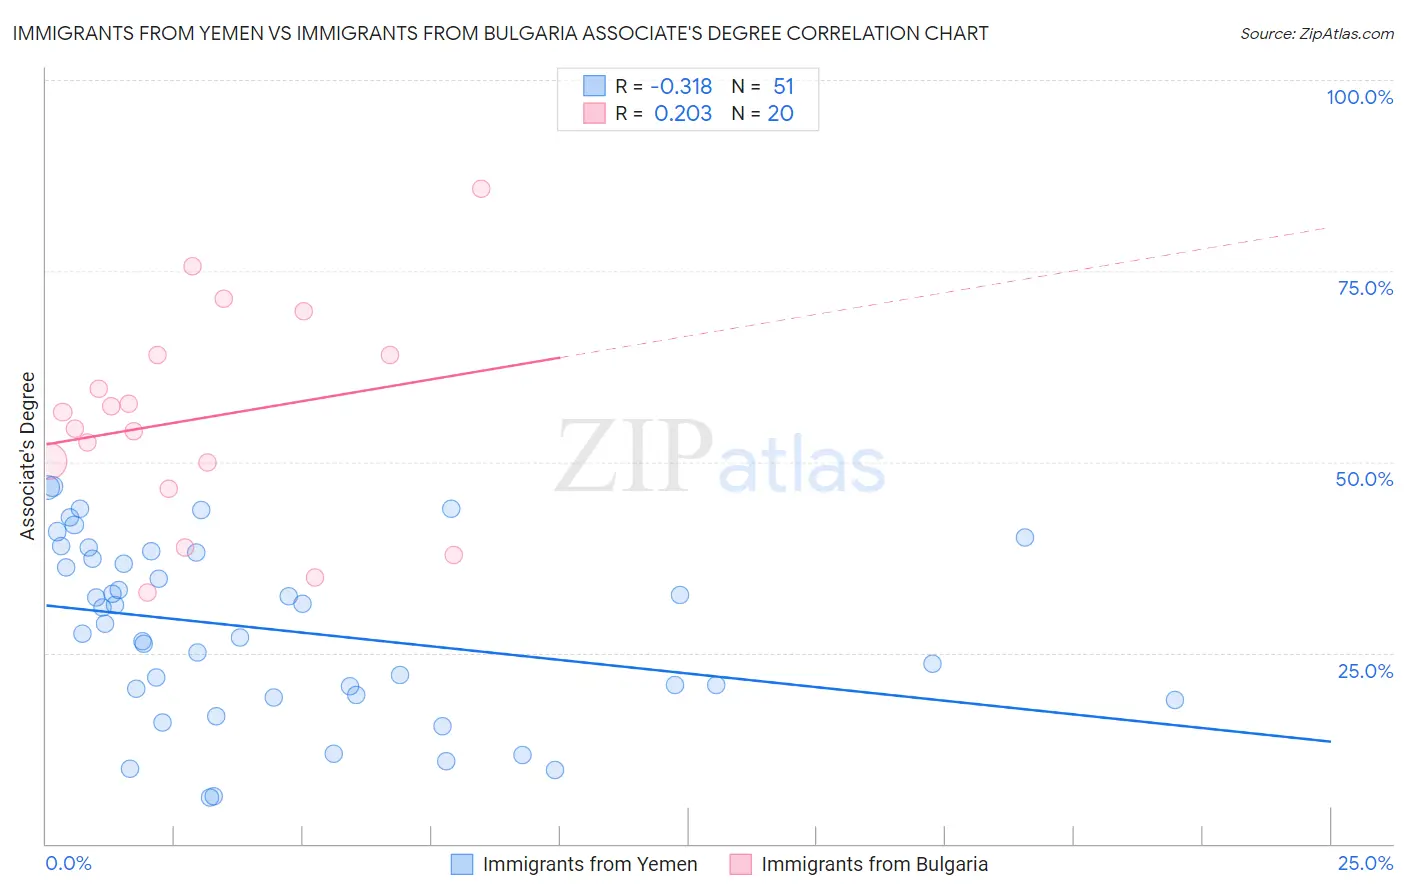
Immigrants from Yemen vs Immigrants from Bulgaria Associate's Degree Correlation Chart
The statistical analysis conducted on geographies consisting of 82,433,611 people shows a mild negative correlation between the proportion of Immigrants from Yemen and percentage of population with at least associate's degree education in the United States with a correlation coefficient (R) of -0.318 and weighted average of 37.3%. Similarly, the statistical analysis conducted on geographies consisting of 172,549,252 people shows a weak positive correlation between the proportion of Immigrants from Bulgaria and percentage of population with at least associate's degree education in the United States with a correlation coefficient (R) of 0.203 and weighted average of 52.4%, a difference of 40.3%.
Associate's Degree Correlation Summary
| Measurement | Immigrants from Yemen | Immigrants from Bulgaria |
| Minimum | 6.0% | 32.8% |
| Maximum | 46.7% | 85.8% |
| Range | 40.7% | 52.9% |
| Mean | 28.0% | 55.7% |
| Median | 28.8% | 55.5% |
| Interquartile 25% (IQ1) | 19.5% | 48.2% |
| Interquartile 75% (IQ3) | 38.1% | 64.0% |
| Interquartile Range (IQR) | 18.6% | 15.8% |
| Standard Deviation (Sample) | 11.4% | 13.8% |
| Standard Deviation (Population) | 11.3% | 13.5% |
Similar Demographics by Associate's Degree
Demographics Similar to Immigrants from Yemen by Associate's Degree
In terms of associate's degree, the demographic groups most similar to Immigrants from Yemen are Cajun (37.4%, a difference of 0.12%), Fijian (37.4%, a difference of 0.15%), Pennsylvania German (37.2%, a difference of 0.29%), Alaska Native (37.5%, a difference of 0.37%), and Yaqui (37.6%, a difference of 0.60%).
| Demographics | Rating | Rank | Associate's Degree |
| Seminole | 0.0 /100 | #314 | Tragic 37.7% |
| Creek | 0.0 /100 | #315 | Tragic 37.6% |
| Crow | 0.0 /100 | #316 | Tragic 37.6% |
| Yaqui | 0.0 /100 | #317 | Tragic 37.6% |
| Alaska Natives | 0.0 /100 | #318 | Tragic 37.5% |
| Fijians | 0.0 /100 | #319 | Tragic 37.4% |
| Cajuns | 0.0 /100 | #320 | Tragic 37.4% |
| Immigrants | Yemen | 0.0 /100 | #321 | Tragic 37.3% |
| Pennsylvania Germans | 0.0 /100 | #322 | Tragic 37.2% |
| Immigrants | Cabo Verde | 0.0 /100 | #323 | Tragic 36.8% |
| Arapaho | 0.0 /100 | #324 | Tragic 36.7% |
| Menominee | 0.0 /100 | #325 | Tragic 36.7% |
| Kiowa | 0.0 /100 | #326 | Tragic 36.5% |
| Dutch West Indians | 0.0 /100 | #327 | Tragic 36.5% |
| Alaskan Athabascans | 0.0 /100 | #328 | Tragic 36.5% |
Demographics Similar to Immigrants from Bulgaria by Associate's Degree
In terms of associate's degree, the demographic groups most similar to Immigrants from Bulgaria are Immigrants from Kuwait (52.4%, a difference of 0.010%), Immigrants from Lithuania (52.4%, a difference of 0.13%), Estonian (52.5%, a difference of 0.21%), Immigrants from Norway (52.2%, a difference of 0.27%), and Immigrants from South Africa (52.5%, a difference of 0.30%).
| Demographics | Rating | Rank | Associate's Degree |
| Immigrants | Belarus | 99.9 /100 | #39 | Exceptional 52.8% |
| Immigrants | Latvia | 99.9 /100 | #40 | Exceptional 52.8% |
| Immigrants | Saudi Arabia | 99.9 /100 | #41 | Exceptional 52.6% |
| Immigrants | Malaysia | 99.9 /100 | #42 | Exceptional 52.5% |
| Immigrants | South Africa | 99.9 /100 | #43 | Exceptional 52.5% |
| Estonians | 99.9 /100 | #44 | Exceptional 52.5% |
| Immigrants | Lithuania | 99.9 /100 | #45 | Exceptional 52.4% |
| Immigrants | Bulgaria | 99.9 /100 | #46 | Exceptional 52.4% |
| Immigrants | Kuwait | 99.9 /100 | #47 | Exceptional 52.4% |
| Immigrants | Norway | 99.9 /100 | #48 | Exceptional 52.2% |
| Immigrants | Austria | 99.9 /100 | #49 | Exceptional 52.1% |
| Asians | 99.9 /100 | #50 | Exceptional 52.1% |
| Immigrants | Greece | 99.9 /100 | #51 | Exceptional 52.1% |
| Bolivians | 99.8 /100 | #52 | Exceptional 52.0% |
| Immigrants | Asia | 99.8 /100 | #53 | Exceptional 52.0% |