Spaniard vs Immigrants from Middle Africa College, Under 1 year
COMPARE
Spaniard
Immigrants from Middle Africa
College, Under 1 year
College, Under 1 year Comparison
Spaniards
Immigrants from Middle Africa
65.3%
COLLEGE, UNDER 1 YEAR
45.5/ 100
METRIC RATING
181st/ 347
METRIC RANK
63.9%
COLLEGE, UNDER 1 YEAR
10.5/ 100
METRIC RATING
212th/ 347
METRIC RANK
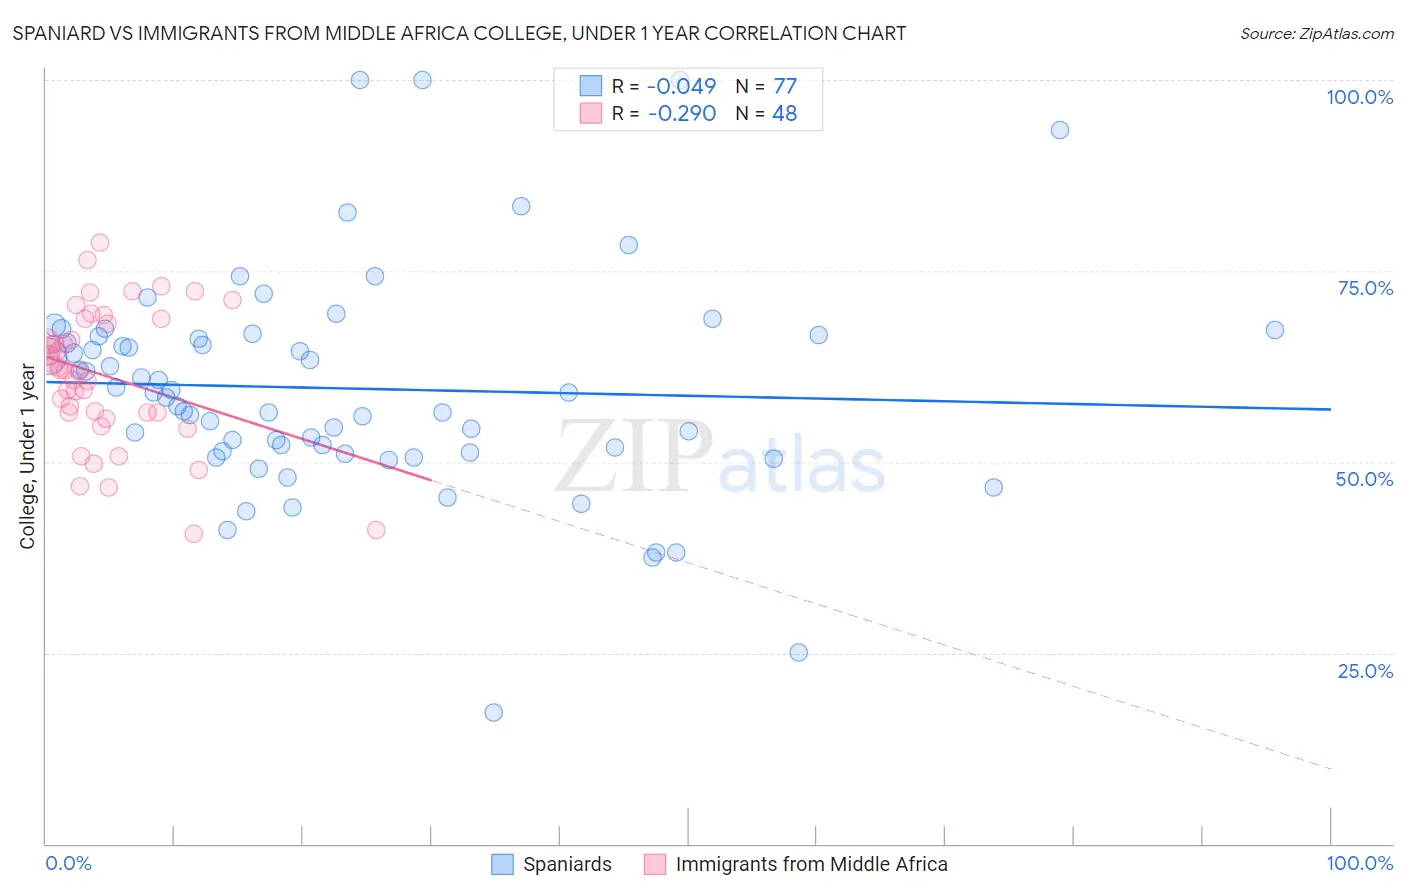
Spaniard vs Immigrants from Middle Africa College, Under 1 year Correlation Chart
The statistical analysis conducted on geographies consisting of 443,543,124 people shows no correlation between the proportion of Spaniards and percentage of population with at least college, under 1 year education in the United States with a correlation coefficient (R) of -0.049 and weighted average of 65.3%. Similarly, the statistical analysis conducted on geographies consisting of 202,746,410 people shows a weak negative correlation between the proportion of Immigrants from Middle Africa and percentage of population with at least college, under 1 year education in the United States with a correlation coefficient (R) of -0.290 and weighted average of 63.9%, a difference of 2.2%.
College, Under 1 year Correlation Summary
| Measurement | Spaniard | Immigrants from Middle Africa |
| Minimum | 17.2% | 40.6% |
| Maximum | 100.0% | 78.7% |
| Range | 82.8% | 38.1% |
| Mean | 59.6% | 61.3% |
| Median | 59.1% | 62.1% |
| Interquartile 25% (IQ1) | 51.3% | 56.4% |
| Interquartile 75% (IQ3) | 66.5% | 68.4% |
| Interquartile Range (IQR) | 15.2% | 11.9% |
| Standard Deviation (Sample) | 14.6% | 8.8% |
| Standard Deviation (Population) | 14.5% | 8.7% |
Similar Demographics by College, Under 1 year
Demographics Similar to Spaniards by College, Under 1 year
In terms of college, under 1 year, the demographic groups most similar to Spaniards are Dutch (65.3%, a difference of 0.030%), Immigrants from Africa (65.3%, a difference of 0.040%), German Russian (65.4%, a difference of 0.12%), Guamanian/Chamorro (65.4%, a difference of 0.12%), and Immigrants from Poland (65.2%, a difference of 0.13%).
| Demographics | Rating | Rank | College, Under 1 year |
| Immigrants | Bosnia and Herzegovina | 50.0 /100 | #174 | Average 65.4% |
| Scotch-Irish | 49.5 /100 | #175 | Average 65.4% |
| French | 48.9 /100 | #176 | Average 65.4% |
| Immigrants | North Macedonia | 48.6 /100 | #177 | Average 65.4% |
| German Russians | 48.3 /100 | #178 | Average 65.4% |
| Guamanians/Chamorros | 48.2 /100 | #179 | Average 65.4% |
| Dutch | 46.1 /100 | #180 | Average 65.3% |
| Spaniards | 45.5 /100 | #181 | Average 65.3% |
| Immigrants | Africa | 44.7 /100 | #182 | Average 65.3% |
| Immigrants | Poland | 42.6 /100 | #183 | Average 65.2% |
| Bermudans | 42.0 /100 | #184 | Average 65.2% |
| Sri Lankans | 41.7 /100 | #185 | Average 65.2% |
| Immigrants | Sierra Leone | 39.7 /100 | #186 | Fair 65.1% |
| Immigrants | Southern Europe | 34.3 /100 | #187 | Fair 64.9% |
| Immigrants | Albania | 32.0 /100 | #188 | Fair 64.9% |
Demographics Similar to Immigrants from Middle Africa by College, Under 1 year
In terms of college, under 1 year, the demographic groups most similar to Immigrants from Middle Africa are Native Hawaiian (63.9%, a difference of 0.010%), Ghanaian (63.9%, a difference of 0.080%), Puget Sound Salish (63.9%, a difference of 0.090%), Immigrants from Vietnam (64.0%, a difference of 0.18%), and Immigrants from South America (63.8%, a difference of 0.18%).
| Demographics | Rating | Rank | College, Under 1 year |
| Peruvians | 13.7 /100 | #205 | Poor 64.1% |
| Whites/Caucasians | 12.8 /100 | #206 | Poor 64.0% |
| Colombians | 12.4 /100 | #207 | Poor 64.0% |
| Immigrants | Vietnam | 12.1 /100 | #208 | Poor 64.0% |
| Puget Sound Salish | 11.3 /100 | #209 | Poor 63.9% |
| Ghanaians | 11.2 /100 | #210 | Poor 63.9% |
| Native Hawaiians | 10.6 /100 | #211 | Poor 63.9% |
| Immigrants | Middle Africa | 10.5 /100 | #212 | Poor 63.9% |
| Immigrants | South America | 9.1 /100 | #213 | Tragic 63.8% |
| Immigrants | Nigeria | 8.8 /100 | #214 | Tragic 63.7% |
| Senegalese | 7.7 /100 | #215 | Tragic 63.6% |
| Hmong | 6.8 /100 | #216 | Tragic 63.5% |
| Immigrants | Uruguay | 5.8 /100 | #217 | Tragic 63.4% |
| Immigrants | Panama | 5.7 /100 | #218 | Tragic 63.4% |
| Immigrants | Fiji | 5.7 /100 | #219 | Tragic 63.4% |