Immigrants from Western Europe vs Barbadian GED/Equivalency
COMPARE
Immigrants from Western Europe
Barbadian
GED/Equivalency
GED/Equivalency Comparison
Immigrants from Western Europe
Barbadians
87.3%
GED/EQUIVALENCY
97.3/ 100
METRIC RATING
97th/ 347
METRIC RANK
82.9%
GED/EQUIVALENCY
0.1/ 100
METRIC RATING
272nd/ 347
METRIC RANK
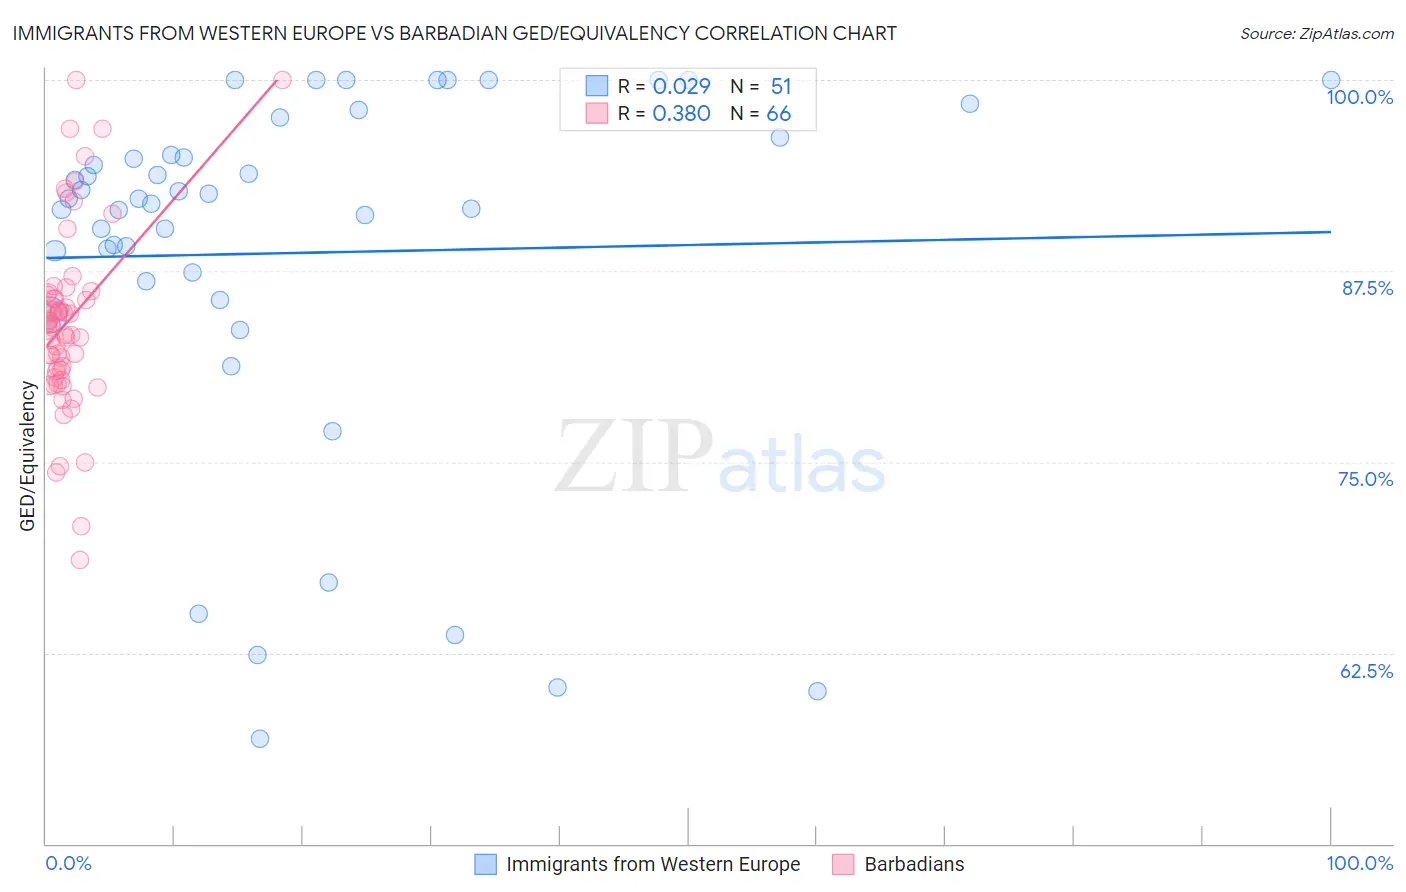
Immigrants from Western Europe vs Barbadian GED/Equivalency Correlation Chart
The statistical analysis conducted on geographies consisting of 494,080,521 people shows no correlation between the proportion of Immigrants from Western Europe and percentage of population with at least ged/equivalency education in the United States with a correlation coefficient (R) of 0.029 and weighted average of 87.3%. Similarly, the statistical analysis conducted on geographies consisting of 141,302,824 people shows a mild positive correlation between the proportion of Barbadians and percentage of population with at least ged/equivalency education in the United States with a correlation coefficient (R) of 0.380 and weighted average of 82.9%, a difference of 5.4%.
GED/Equivalency Correlation Summary
| Measurement | Immigrants from Western Europe | Barbadian |
| Minimum | 56.9% | 68.6% |
| Maximum | 100.0% | 100.0% |
| Range | 43.1% | 31.4% |
| Mean | 88.7% | 84.2% |
| Median | 92.2% | 83.9% |
| Interquartile 25% (IQ1) | 86.8% | 80.9% |
| Interquartile 75% (IQ3) | 96.2% | 85.9% |
| Interquartile Range (IQR) | 9.4% | 5.0% |
| Standard Deviation (Sample) | 11.9% | 6.0% |
| Standard Deviation (Population) | 11.8% | 6.0% |
Similar Demographics by GED/Equivalency
Demographics Similar to Immigrants from Western Europe by GED/Equivalency
In terms of ged/equivalency, the demographic groups most similar to Immigrants from Western Europe are Czechoslovakian (87.4%, a difference of 0.070%), Immigrants from Croatia (87.3%, a difference of 0.070%), Immigrants from Belarus (87.3%, a difference of 0.070%), Immigrants from Greece (87.4%, a difference of 0.090%), and Palestinian (87.3%, a difference of 0.090%).
| Demographics | Rating | Rank | GED/Equivalency |
| Welsh | 97.9 /100 | #90 | Exceptional 87.4% |
| Immigrants | Eastern Asia | 97.9 /100 | #91 | Exceptional 87.4% |
| Israelis | 97.8 /100 | #92 | Exceptional 87.4% |
| Immigrants | North Macedonia | 97.8 /100 | #93 | Exceptional 87.4% |
| Immigrants | Russia | 97.8 /100 | #94 | Exceptional 87.4% |
| Immigrants | Greece | 97.7 /100 | #95 | Exceptional 87.4% |
| Czechoslovakians | 97.6 /100 | #96 | Exceptional 87.4% |
| Immigrants | Western Europe | 97.3 /100 | #97 | Exceptional 87.3% |
| Immigrants | Croatia | 96.9 /100 | #98 | Exceptional 87.3% |
| Immigrants | Belarus | 96.9 /100 | #99 | Exceptional 87.3% |
| Palestinians | 96.8 /100 | #100 | Exceptional 87.3% |
| Syrians | 96.6 /100 | #101 | Exceptional 87.2% |
| Lebanese | 96.2 /100 | #102 | Exceptional 87.2% |
| Jordanians | 96.1 /100 | #103 | Exceptional 87.2% |
| Immigrants | Hungary | 96.0 /100 | #104 | Exceptional 87.2% |
Demographics Similar to Barbadians by GED/Equivalency
In terms of ged/equivalency, the demographic groups most similar to Barbadians are Pennsylvania German (82.9%, a difference of 0.010%), Immigrants from Trinidad and Tobago (82.8%, a difference of 0.020%), U.S. Virgin Islander (82.9%, a difference of 0.040%), Immigrants from Jamaica (82.9%, a difference of 0.080%), and Seminole (82.8%, a difference of 0.090%).
| Demographics | Rating | Rank | GED/Equivalency |
| West Indians | 0.2 /100 | #265 | Tragic 83.1% |
| Kiowa | 0.2 /100 | #266 | Tragic 83.1% |
| Trinidadians and Tobagonians | 0.2 /100 | #267 | Tragic 83.0% |
| Immigrants | Burma/Myanmar | 0.2 /100 | #268 | Tragic 83.0% |
| Hopi | 0.2 /100 | #269 | Tragic 83.0% |
| Immigrants | Jamaica | 0.2 /100 | #270 | Tragic 82.9% |
| U.S. Virgin Islanders | 0.2 /100 | #271 | Tragic 82.9% |
| Barbadians | 0.1 /100 | #272 | Tragic 82.9% |
| Pennsylvania Germans | 0.1 /100 | #273 | Tragic 82.9% |
| Immigrants | Trinidad and Tobago | 0.1 /100 | #274 | Tragic 82.8% |
| Seminole | 0.1 /100 | #275 | Tragic 82.8% |
| Blacks/African Americans | 0.1 /100 | #276 | Tragic 82.8% |
| Arapaho | 0.1 /100 | #277 | Tragic 82.8% |
| Immigrants | Laos | 0.1 /100 | #278 | Tragic 82.7% |
| Immigrants | Fiji | 0.1 /100 | #279 | Tragic 82.7% |