Immigrants from West Indies vs Spanish GED/Equivalency
COMPARE
Immigrants from West Indies
Spanish
GED/Equivalency
GED/Equivalency Comparison
Immigrants from West Indies
Spanish
82.4%
GED/EQUIVALENCY
0.0/ 100
METRIC RATING
286th/ 347
METRIC RANK
85.4%
GED/EQUIVALENCY
32.8/ 100
METRIC RATING
185th/ 347
METRIC RANK
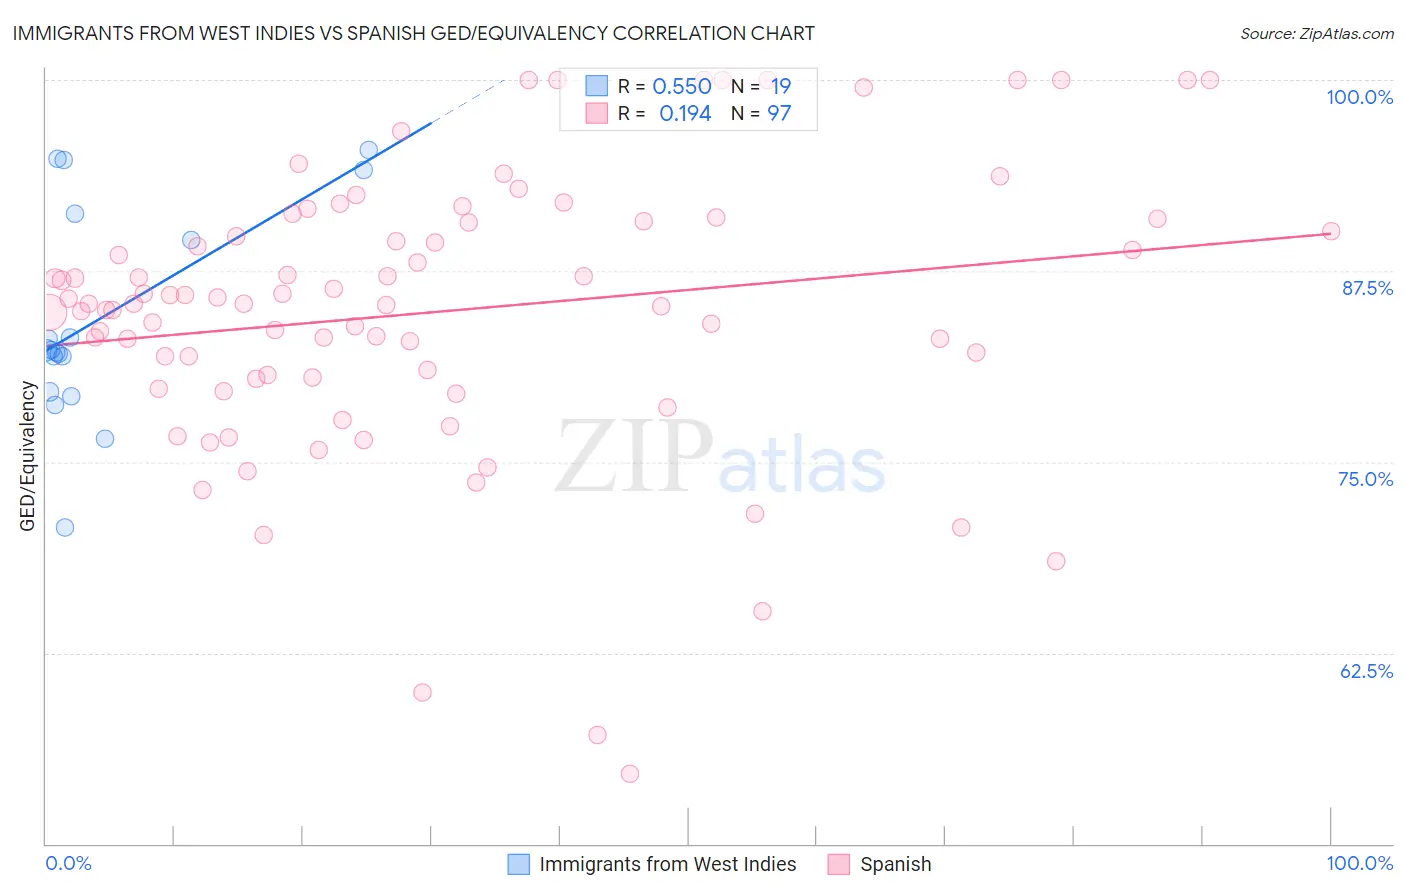
Immigrants from West Indies vs Spanish GED/Equivalency Correlation Chart
The statistical analysis conducted on geographies consisting of 72,457,514 people shows a substantial positive correlation between the proportion of Immigrants from West Indies and percentage of population with at least ged/equivalency education in the United States with a correlation coefficient (R) of 0.550 and weighted average of 82.4%. Similarly, the statistical analysis conducted on geographies consisting of 422,188,828 people shows a poor positive correlation between the proportion of Spanish and percentage of population with at least ged/equivalency education in the United States with a correlation coefficient (R) of 0.194 and weighted average of 85.4%, a difference of 3.7%.
GED/Equivalency Correlation Summary
| Measurement | Immigrants from West Indies | Spanish |
| Minimum | 70.7% | 54.5% |
| Maximum | 95.4% | 100.0% |
| Range | 24.7% | 45.5% |
| Mean | 84.4% | 84.8% |
| Median | 82.3% | 85.4% |
| Interquartile 25% (IQ1) | 79.6% | 80.5% |
| Interquartile 75% (IQ3) | 91.2% | 90.7% |
| Interquartile Range (IQR) | 11.7% | 10.3% |
| Standard Deviation (Sample) | 7.0% | 9.2% |
| Standard Deviation (Population) | 6.8% | 9.1% |
Similar Demographics by GED/Equivalency
Demographics Similar to Immigrants from West Indies by GED/Equivalency
In terms of ged/equivalency, the demographic groups most similar to Immigrants from West Indies are Cajun (82.4%, a difference of 0.020%), Japanese (82.4%, a difference of 0.020%), Immigrants from Barbados (82.4%, a difference of 0.060%), Pueblo (82.3%, a difference of 0.12%), and Indonesian (82.5%, a difference of 0.18%).
| Demographics | Rating | Rank | GED/Equivalency |
| Immigrants | Fiji | 0.1 /100 | #279 | Tragic 82.7% |
| Cheyenne | 0.1 /100 | #280 | Tragic 82.7% |
| Sioux | 0.1 /100 | #281 | Tragic 82.6% |
| Immigrants | Immigrants | 0.1 /100 | #282 | Tragic 82.6% |
| Indonesians | 0.1 /100 | #283 | Tragic 82.5% |
| Immigrants | Barbados | 0.1 /100 | #284 | Tragic 82.4% |
| Cajuns | 0.0 /100 | #285 | Tragic 82.4% |
| Immigrants | West Indies | 0.0 /100 | #286 | Tragic 82.4% |
| Japanese | 0.0 /100 | #287 | Tragic 82.4% |
| Pueblo | 0.0 /100 | #288 | Tragic 82.3% |
| Immigrants | Cambodia | 0.0 /100 | #289 | Tragic 82.2% |
| Haitians | 0.0 /100 | #290 | Tragic 82.1% |
| Cubans | 0.0 /100 | #291 | Tragic 82.0% |
| Paiute | 0.0 /100 | #292 | Tragic 82.0% |
| British West Indians | 0.0 /100 | #293 | Tragic 82.0% |
Demographics Similar to Spanish by GED/Equivalency
In terms of ged/equivalency, the demographic groups most similar to Spanish are Immigrants from Oceania (85.5%, a difference of 0.020%), Spaniard (85.4%, a difference of 0.020%), Immigrants from Sudan (85.5%, a difference of 0.030%), Sudanese (85.5%, a difference of 0.050%), and Immigrants from Afghanistan (85.4%, a difference of 0.070%).
| Demographics | Rating | Rank | GED/Equivalency |
| Koreans | 41.2 /100 | #178 | Average 85.6% |
| Aleuts | 40.5 /100 | #179 | Average 85.6% |
| Immigrants | Southern Europe | 38.4 /100 | #180 | Fair 85.5% |
| Moroccans | 37.7 /100 | #181 | Fair 85.5% |
| Sudanese | 35.2 /100 | #182 | Fair 85.5% |
| Immigrants | Sudan | 34.2 /100 | #183 | Fair 85.5% |
| Immigrants | Oceania | 33.6 /100 | #184 | Fair 85.5% |
| Spanish | 32.8 /100 | #185 | Fair 85.4% |
| Spaniards | 31.9 /100 | #186 | Fair 85.4% |
| Immigrants | Afghanistan | 29.8 /100 | #187 | Fair 85.4% |
| Immigrants | Sierra Leone | 29.0 /100 | #188 | Fair 85.4% |
| Guamanians/Chamorros | 28.4 /100 | #189 | Fair 85.3% |
| Alaskan Athabascans | 27.5 /100 | #190 | Fair 85.3% |
| South American Indians | 22.8 /100 | #191 | Fair 85.2% |
| Immigrants | Nonimmigrants | 22.7 /100 | #192 | Fair 85.2% |